
Figure 9.
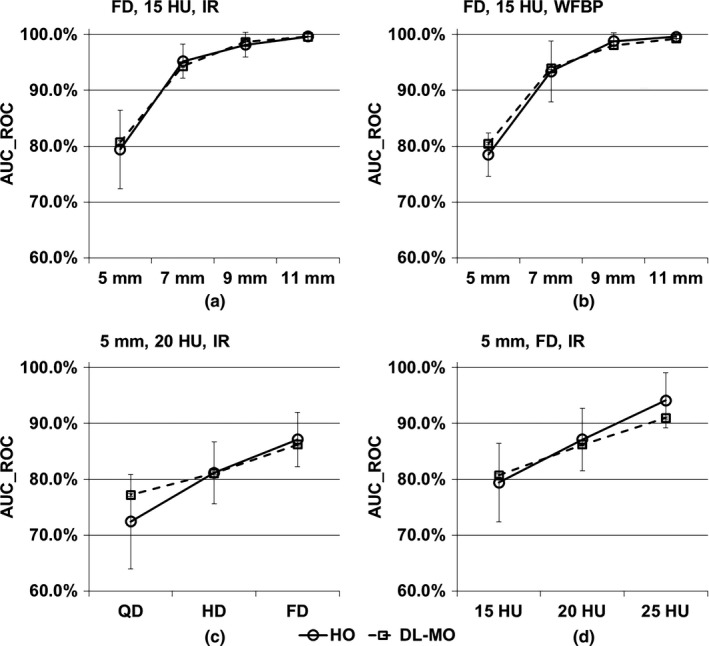
Comparison of deep learning‐based model observer (DL‐MO) and human observer (HO) in four scenarios. (a) Lesion size was varied across 5, 7, 9, and 11 mm, lesion contrast was 15 HU, computed tomography (CT) images were acquired with iterative reconstruction (IR) at full routine dose (FD). (b) Similar to the scenario in (a), but CT images were reconstructed with weighted filtered back projection (WFBP). (c) Lesion size was 5 mm, lesion contrast was 20 HU, CT images were reconstructed with IR across full, half, and quarter of routine radiation dose level (FD, HD & QD). (d) Lesion size was 5 mm, lesion contrast was varied across 15, 20, and 25 HU; CT images were acquired with IR at FD. The error bars indicate the standard deviation of the area under receiver operating characteristic curve (AUC_ROC).