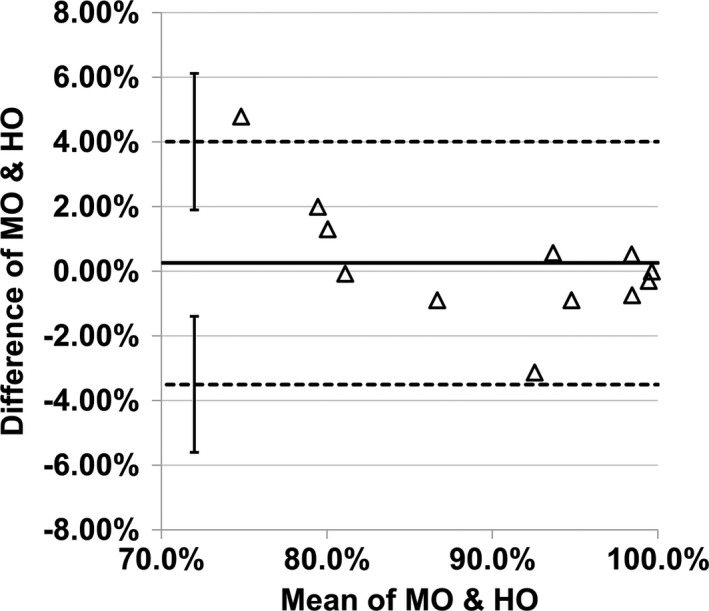
Figure 10.

Bland–Altman plot of the difference of area under the receiver operating characteristic curve across all 12 experimental conditions. The two dashed lines denote the upper and the lower limits of agreement (LOA). The solid line denotes the bias. The error bars indicate the 95% confidence interval of LOA.
