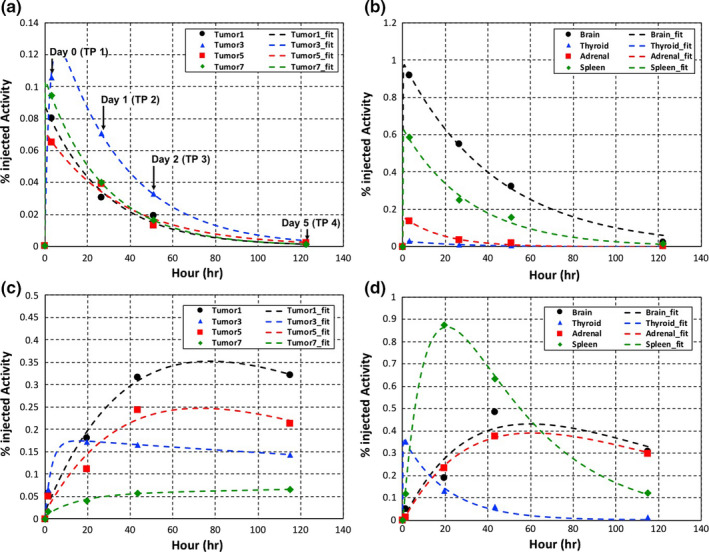
Figure 3.

Time–activity curves and biexponential fits for tumors (a, c) and organs (b, d) from two representative patients (upper and bottom). The bottom patient has time–activity curves with slope+ between two time points for percent of injected activities. [Color figure can be viewed at wileyonlinelibrary.com]
