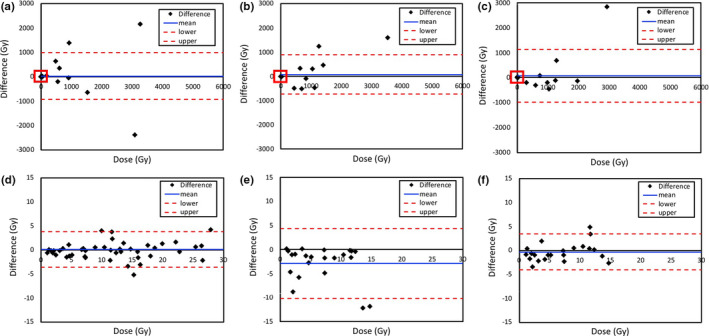
Figure 8.

Difference in calculated doses between reference tumor doses using the 3 or 4 time points and tumor doses calculated using the two‐time points with percent of injected activities (%IAs) 1_2TP (a, d), %IAs 2_3TP (b, e), and %IAs 1_3TP (c, f). The enlarged portions of plots (d, e, f) from the red box in the upper plots (a, b, c) show the difference in calculated doses under 100 Gy. [Color figure can be viewed at wileyonlinelibrary.com]
