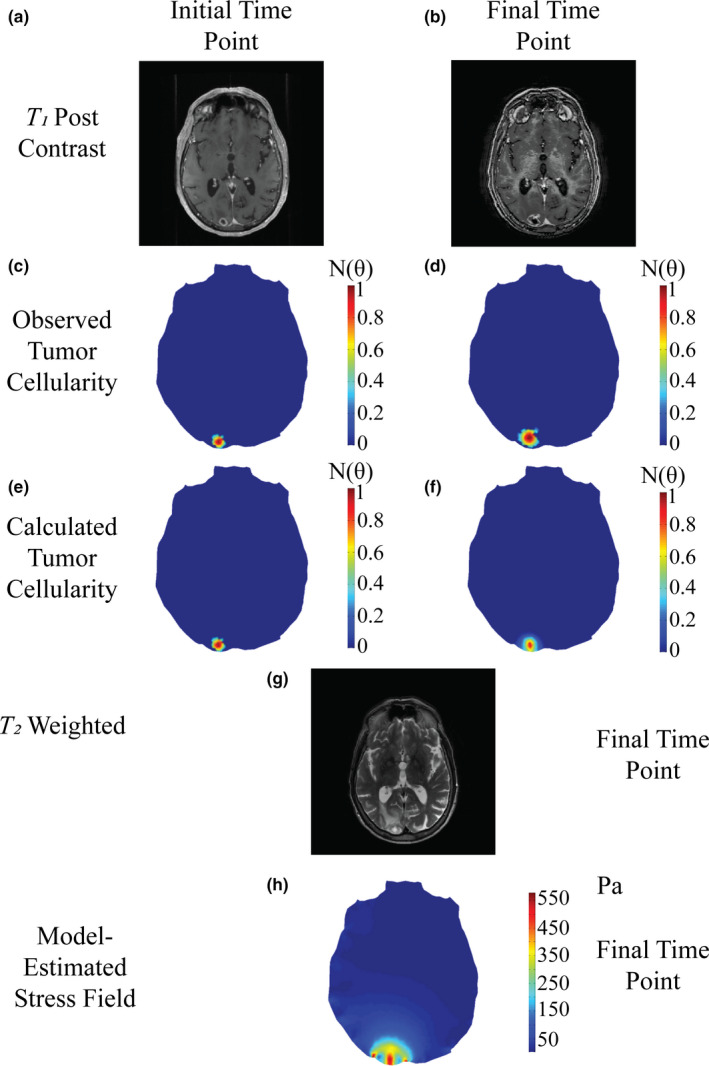
Figure 3.

Patient diagnosed with radiation‐induced necrosis at starting time point (a,c,e), and final time point taken before diagnosis of lesion etiology (b,d,f,g). Post‐contrast T 1 ‐weighted MR images (a,b) are used to estimate observed tumor cellularity (c,d) and the model is fit to estimate tumor cellularity (e,f). T 2 ‐weighted imaging at the time point prior to diagnosis (g) is compared to estimated mechanical stress field (h) at the final time point. [Color figure can be viewed at wileyonlinelibrary.com]
