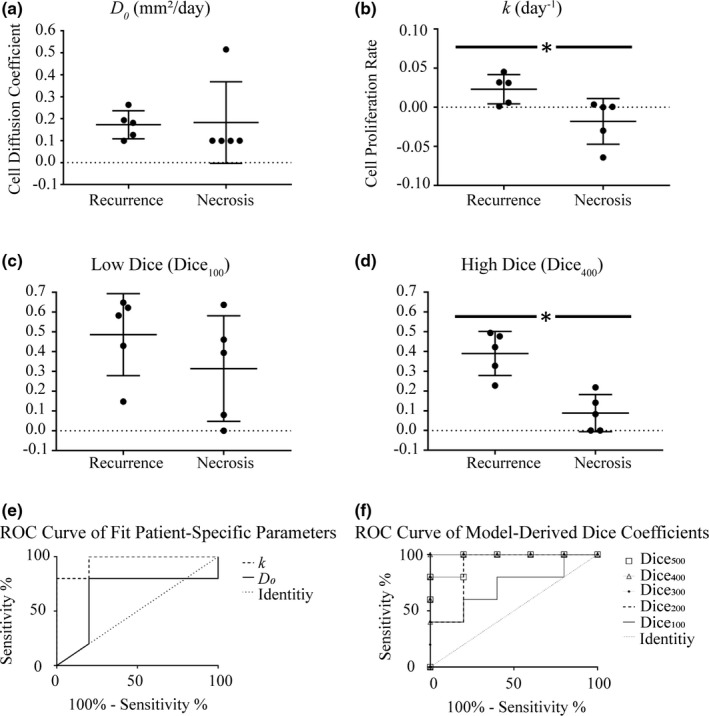
Figure 4.

Distribution plots for (a) cell diffusion coefficient (D 0, mm2/day), (b) cell proliferation rate (k, day−1), (c) low stress isocontour Dice coefficient (Dice100), and (d) high stress isocontour Dice coefficient (Dice400) for patients with tumor recurrence and radiation‐induced necrosis. The middle horizontal line in both represents the mean value; the outer two lines represent the standard deviations. The ROC curve for (e) cell diffusion coefficient (D 0) and cell proliferation rate (k) and (f) ROC curve for the Dice correlation coefficients. In both, the dotted line represents the line of identity.
