
Figure 5.
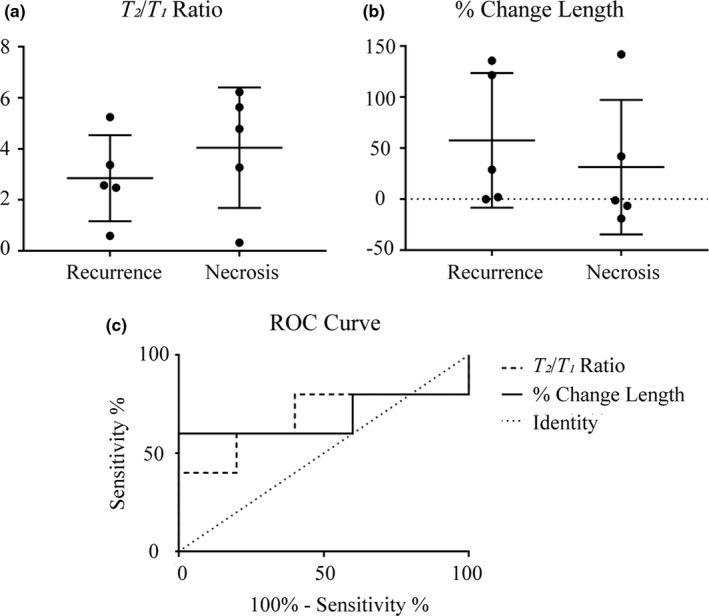
Conventional morphometric assessment methods for determining local control with estimated parameter value distributions for (a) T 2 /T 1 ratio and (b) percent change in length. (c) ROC curve for the morphometric assessment methods. The dotted line represents the line of identity.