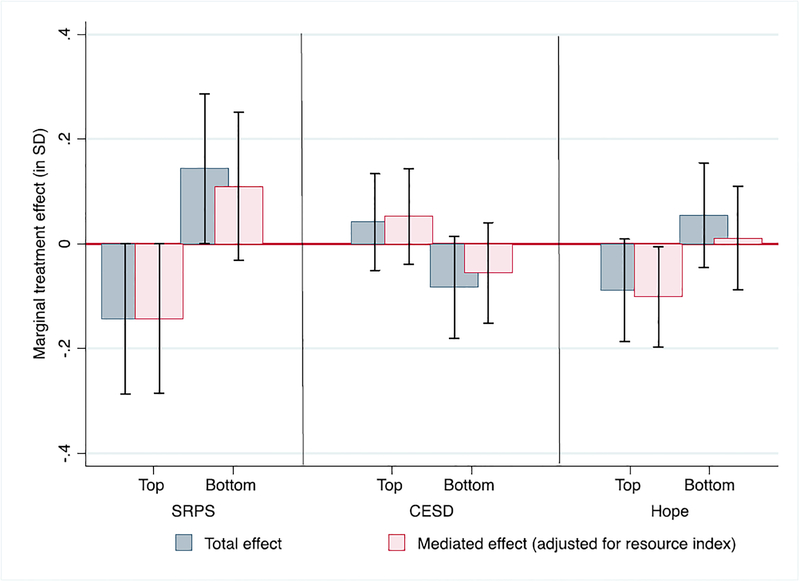
Figure 2. Marginal treatment effects of the CCT on psychosocial wellbeing by baseline poverty status (total and mediated effects).
Estimated marginal treatment effects for each psychosocial outcome grouped by baseline poverty status (top half or bottom half). Each bar represents a separate model. Blue bars are the marginal effect from Table 4 models while the red bars are the marginal effects from Table 5 after accounting for the economic well-being index (excluding paid work).

