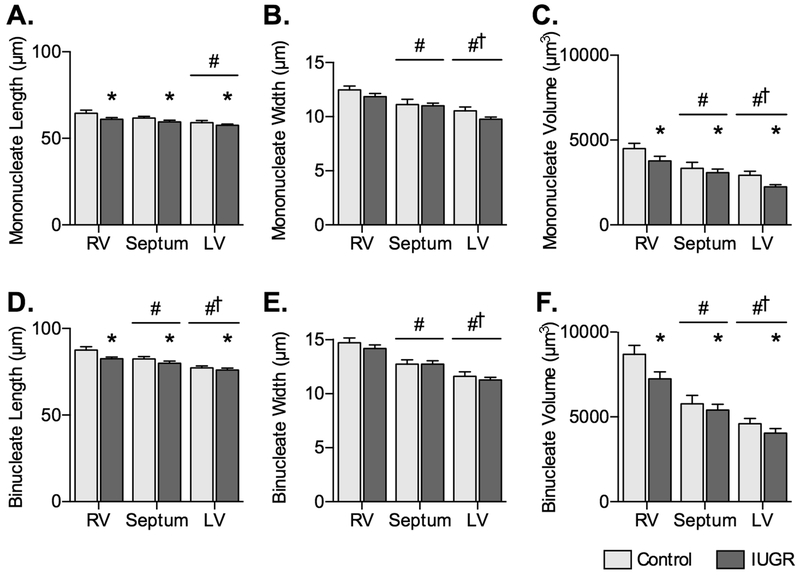
Figure 3. Cardiomyocyte size in control and IUGR fetal sheep.
A) Mononucleated myocyte length, B) width, and C) volume, and D) binucleated myocyte length, E) width, and F) volume in Control fetuses (n=8) and IUGR fetuses (LV n=15, RV and septum n=14) at ~134 dGA. Groups compared by 2-way ANOVA and Holm-Sidak test. Different from *Control, #RV, and †Septum (P<0.05). Data are shown as mean±standard deviation.

