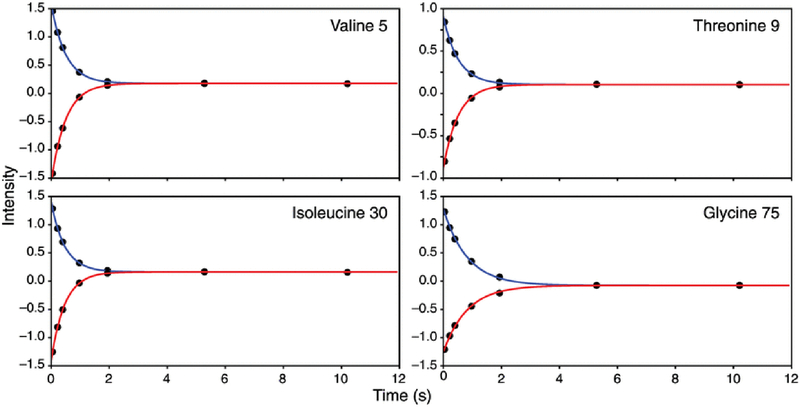
Figure 2.
15N R1 decay curves for Val 5, Thr 9, Ile 30, and Gly 75 in ubiquitin. Data points and fitted decay curves are shown for (blue) positive (I+(T)) and (red) negative (I−(T)) initial 15N magnetization. Data were fit using Eq. 1 using a Levenberg-Marquardt algorithm. Fitted values for R1 are (Val 5) 2.001 ± 0.001, (Thr 9) 1.927 ± 0.016, (Ile 30) 2.1484 ± 0.016, and (Gly 75) 797 ± 0.009 (uncertainties are standard error in the mean of three replicates)

