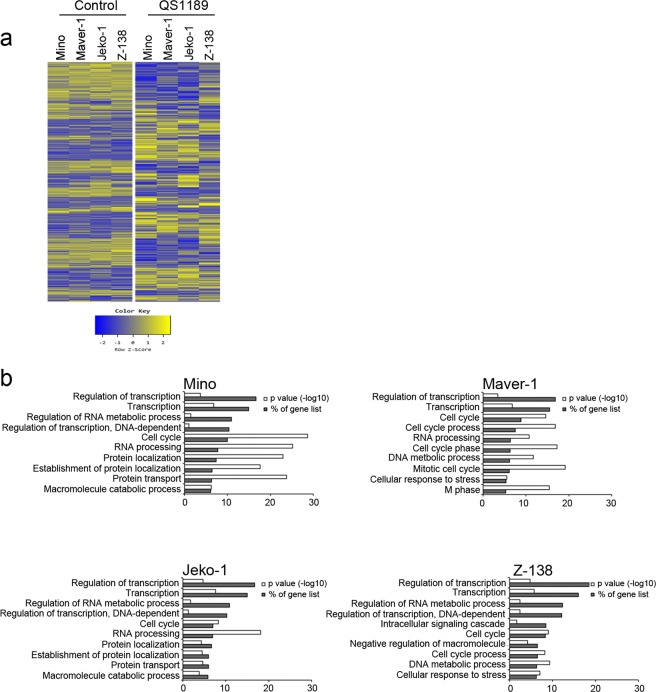
Figure 2.
Transcriptional inhibition in QS1189 treated MCL cells. (a) Heatmap of gene expression in MCL cells treated with 1 μM QS1189 for 6 h. Rows show z-scores calculated for each cell. (b) GO analysis of 2-fold downregulated genes based on biological processes using DAVID software. The top 10 terms were ranked according to “% of gene list” that indicates the percentile of the gene count from the total number of genes in GO terms.

