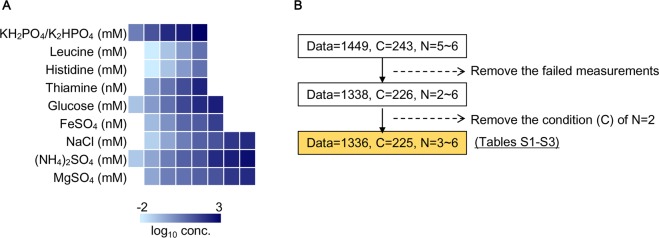
Figure 1.
Overview of the experimental conditions and the data set. (A) Chemical compounds used in the growth assay. The heat map represents the variation in the concentrations of the chemical compounds used in the experiments. The gradation from light to dark blue indicates the concentration from low to high, over a logarithmic scale. (B) Flowchart of the data refinement. Data, C, and N represent the numbers of the individual growth curves acquired in the assay, the tested combinations made up of the ten chemical compounds, and the biological replicates per combination, respectively. The data set highlighted in orange was primarily analysed to reach the conclusion.

