Figure 2.
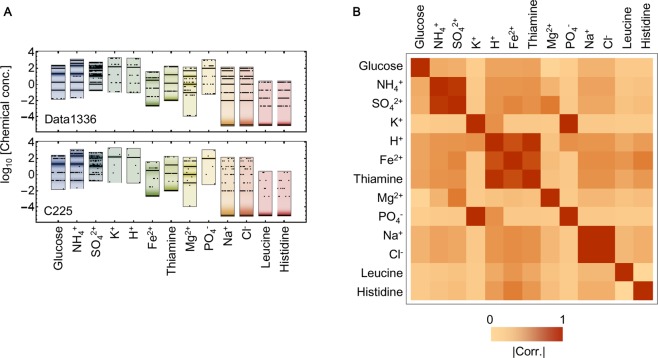
Data distribution and chemical combinations. (A) Data distribution at the single chemical level. A total of 13 chemicals, which are encompassed within the ten compounds, are indicated. The data distributions at the individual chemical levels are shown in coloured bars. The tested concentrations of these 13 chemicals are spotted in black, within the corresponding distribution bars. Those condensed spots appeared as black lines. The upper and bottom panels indicate the distribution of 1336 individual growth curves and the 225 combinations, respectively. (B) Relationships in the concentration changes of 13 individual chemicals. The matrix represents the correlations of the changes to the concentrations of any two chemicals. The gradation from light to dark orange indicates the correlation coefficients (Corr.) from low to high. The chemical elements found in the same compounds usually show high correlations, e.g., the chemical elements of Na+ and Cl−, which form the NaCl compound.

