Figure 6.
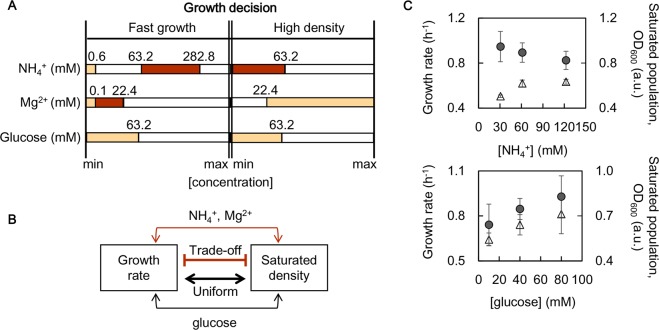
Mechanisms of the decision chemicals. (A) Growth priority decided by the chemical concentrations. The three most common decision chemicals are indicated. The predicted ranges of chemical concentrations optimal for either fast growth or high density are illustrated in the coloured bars. The concentrations of these elements at the branching points are indicated. Two varied choices of chemical combinations are indicated in light and dark orange, respectively. (B) Scheme showing the trade-off and uniform modes. The NH4+ and Mg2+ elements worked in a trade-off manner (bold orange) and glucose worked in a uniform manner (bold black) in determining the growth priority of the speed or quantity. (C) Experimental verification of the trade-off and the uniform contributions of the decision elements. The growth rates and the saturated densities at varied NH4+ and glucose concentrations (upper and lower panels, respectively) are represented by open triangles and filled circles, respectively. The standard errors of repeated tests (N = 5~6) are indicated.

