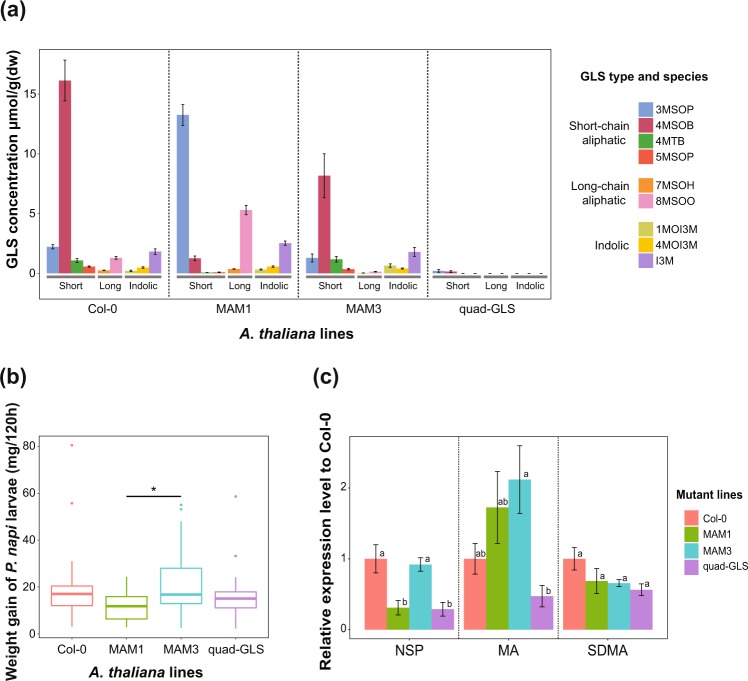
Figure 4.
(a) GLS profiles of Arabidopsis thaliana mutants measured by LC-UV (n = 5). MAM1 showed lower 4MSOB concentration but accumulated higher 3MSOP and 8MSOO than Col-0. MAM3 has a lower long-chain aliphatic GLS concentration, and quad-GLS has no or quite low levels of GLSs. (b) Growth rates of P. napi that fed on the four Arabidopsis thaliana mutant lines. “*” shows significance based on the FDR-adjusted pairwise t test (P ≤ 0.05). Significant differences: MAM1 vs. MAM3 (P = 0.018). (c) Relative expression levels of NSP-like gene family members of P. napi against the four Arabidopsis thaliana mutants. Expression level was normalized based on Col-0 for each gene. Different letters on each box show significance (pairwise t test with FDR adjustment, P ≤ 0.05).

