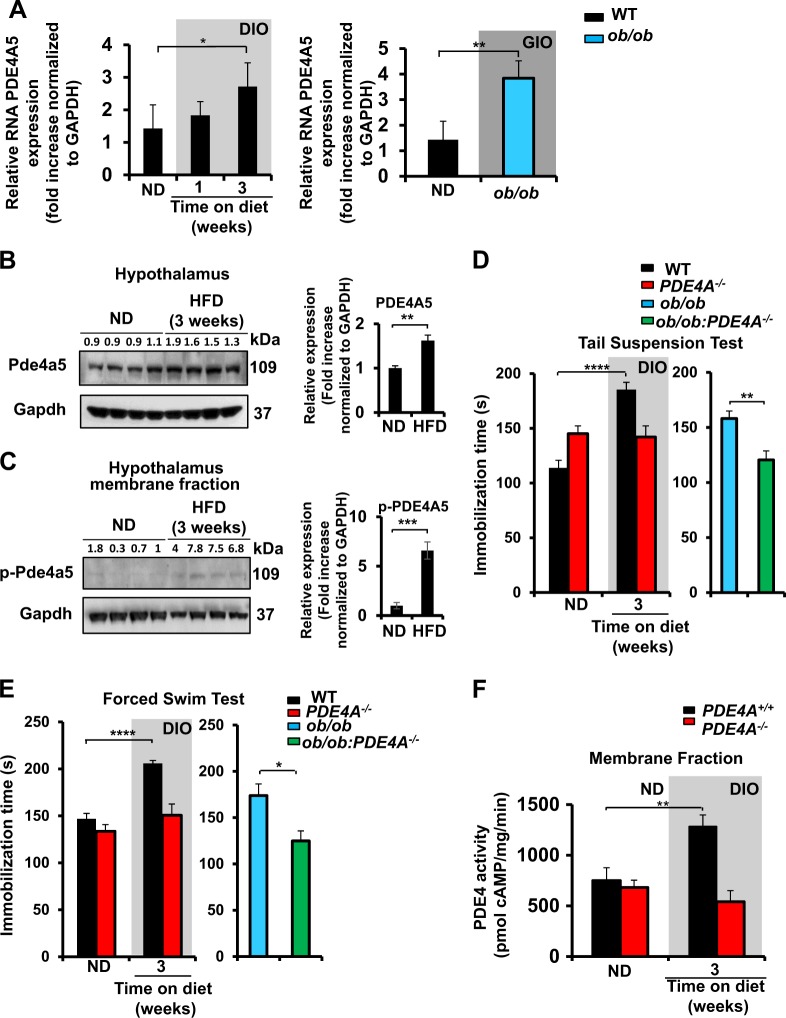
Fig. 3. PDE4A is involved in the depression-like phenotype induced by obesity and HFD increases expression levels and activity of phosphodiesterases 4A5 in the hypothalamus.
a Real-time PCR analysis of PDE4A5 mRNA in the hypothalamus of (left) WT C57BL/6J mice fed either ND or HFD (1 and 3 weeks) (n = 4 per condition; *P < 0.05, by one-way ANOVA with Dunnett’s multiple comparison test) and (right) between WT C57BL/6J mice and ob/ob mice (n = 4 per condition; **P < 0.01 by two-tail unpaired Student's t-test). b (Left) Western blot analysis of Pde4a5 expression in WT C57BL/6J mice fed either ND or HFD. (n = 4 mice per condition, **P < 0.01 by two-tail unpaired Student's t-test). Representative blot (left) and (right) its quantification. c Western blot analysis of phosphorylated-Pde4a5 (p-Pde4a5) expression in WT C57BL/6J mice fed either ND or HFD. (n = 4 mice per condition, ***P < 0.001 by two-tail unpaired Student's t-test). Representative blot (left) and its quantification (right). Gapdh was used as the loading control for all western blots shown in this figure. All data in the figure are represented as mean ± SEM. d Tail suspension and e forced swim tests on PDE4A+/+ and PDE4A−/− mice fed either normal diet (ND) or high-fat diet (HFD) (n = 8–10 mice per condition; ****P < 0.0001 by two-way ANOVA with Sidak’s multiple comparison test) and ob/ob vs ob/ob::PDE4A−/− mice fed ND (n = 7–10 mice per condition; **P < 0.01, *P < 0.05 by two-tail unpaired Student's t-test) DIO: diet-induced obesity. f PDE4 activity in the membrane fraction of hypothalamus collected from PDE4A+/+ and PDE4A−/− mice fed either ND or HFD (n = 5–6 mice per group; **P < 0.01 by two-way ANOVA). All data in the figure are represented as mean ± SEM

