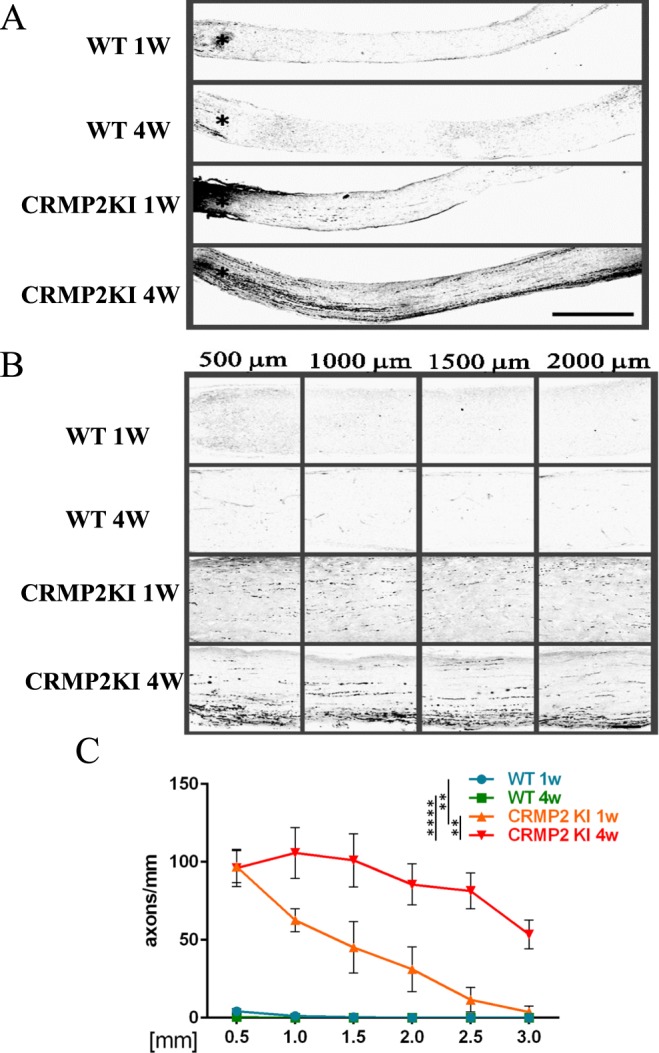
Figure 5.

Histological analysis of optic nerve regeneration with anterograde tracer at one and four weeks after ONC in wild-type (WT) and CRMP2 KI mice. (A) Longitudinal sections of optic nerves after tracer injection in indicated samples. (B) Higher magnification images of the indicated area in (A). Scale bar in (A) = 500 µm and (B) = 100 µm. (C) Quantification of regenerating axons at indicated distances beyond the crush site in optic nerves in comparison with WT and CRMP2 KI mice (n = 5 mice for each genotype). **p < 0.01, ****p < 0.0001.
