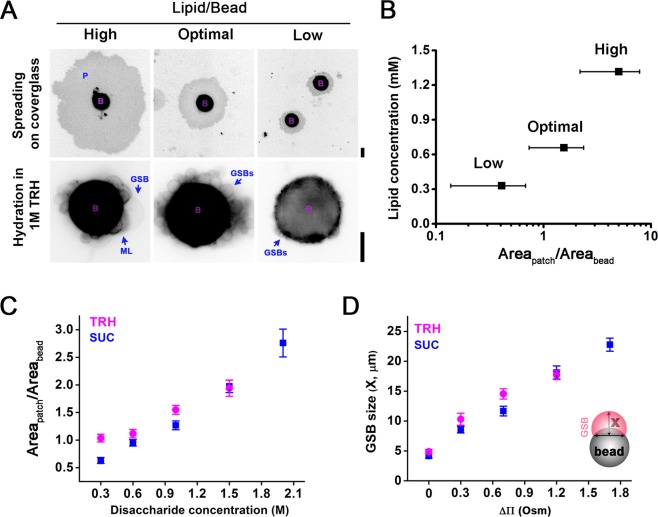
Figure 2.
Optimization of GSBs production. (A) Membrane patches (P) formed by lipids (99.5:0.5 mol% POPC:RhPE) transferred from 40 μm beads (purple “B”s) to a plasma cleansed coved glass (upper row) and representative images of the corresponding GSB samples formed by hydration in 1 M TRH (lower row). Scale bars are 20 μm. (B) Dependence of the lipid to bead ratio (L/B), quantified as the membrane patch area divided by the bead area on the lipid concentration in the initial MLV solution (see Methods). The areas were obtained by analysing images, like those shown in A, with the measuring feature of ImageJ software55,56. Error bars show SEM. n > 30 at each point. (C) L/B ratio, measured as in B, increases with the concentration of disaccharide solutions used at the prehydration step. Data for POPC:RhPE 99.5:0.5 mol% membrane composition are shown. Error bars are SEM. n > 40 for each point. (D) The growth of GSBs induced by osmotic pressure. GSBs prehydrated with different concentrations of disaccharides were subjected to an osmotic shock by their relocation into buffer A, with osmolarity ~300 mOsm. GSB size was estimated as the distance X (see insert) 20 min after GSB transfer to the buffer A. Error bars show SEM, n > 30 for each point.

