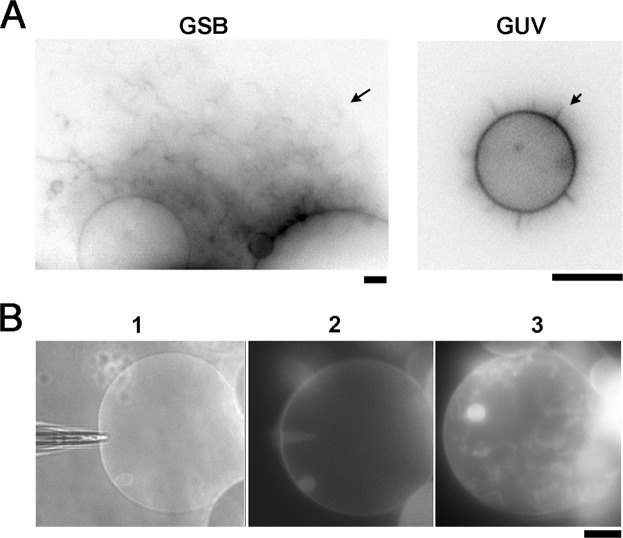
Figure 4.
Tubulation of GSB membrane by Dyn1. (A) Representative images showing tubulation (indicated by arrows) induced by Dyn1 (0.5 µM) on GSB (left) versus GUV (right). The lipid composition in both cases was DOPC:DOPE:DOPS:PI(4,5)P2:Chol:RhPE 58:10:15:2:30:1 mol%. RhPE fluorescence is shown. Scale bar 4 μm. (B) Inwards tubulation of a GSB membrane upon microinjection of Dyn1 (0.5 μM) into the GSB lumen. Overlaid bright field/fluorescence image (1) shows the experimental configuration during piercing of the GSB membrane by the injection pipette. Development of the inward membrane tubulation is shown in images (2) and (3). The lipid composition used was DOPC:DOPE:DOPS:PI(4,5)P2:Chol:RhPE 27:24:15:3:30:1 mol%. Scale bar 15 μm.

