
Fig. 5.
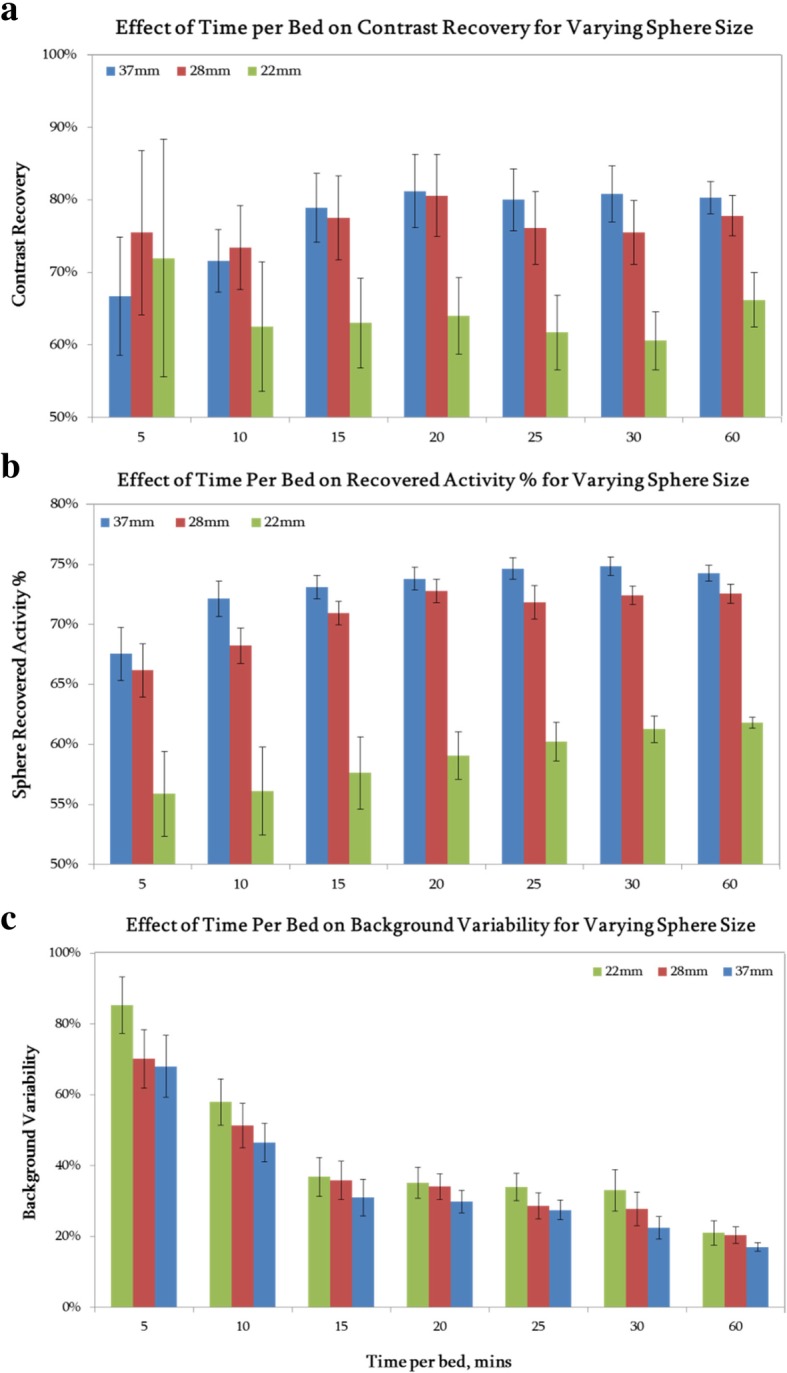
Graphs of a CR, b RAP, and c BV plotted against acquisition length for the low activity (1 GBq) overnight NEMA phantom scan; all images were reconstructed using a beta value of 1000, and results for the three largest spheres are shown. Error bars represent the standard error of the mean