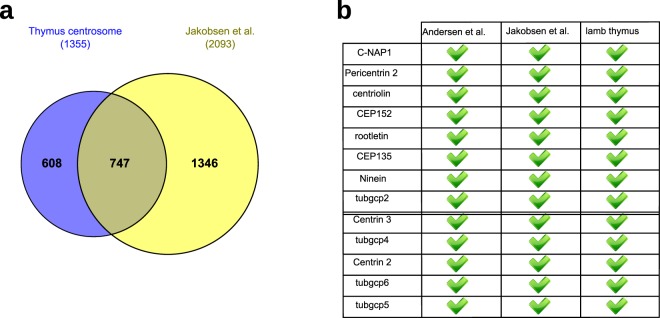
Figure 2.
(a) Quantitative comparison between the proteins detected by mass spectroscopy (MS) in centrosomes isolated from KE37 cells (right circle)58 and the proteins detected by MS in centrosomes isolated from lamb thymocytes (left circle). The total number of proteins in each dataset is shown in parentheses. (b) Panel of well-characterized centrosomal proteins. Top, proteins readily detected in published proteomic studies are shown with a high z-score57 or a large number of peptides58. Bottom, proteins with low scores in the same studies (following the same criteria).

