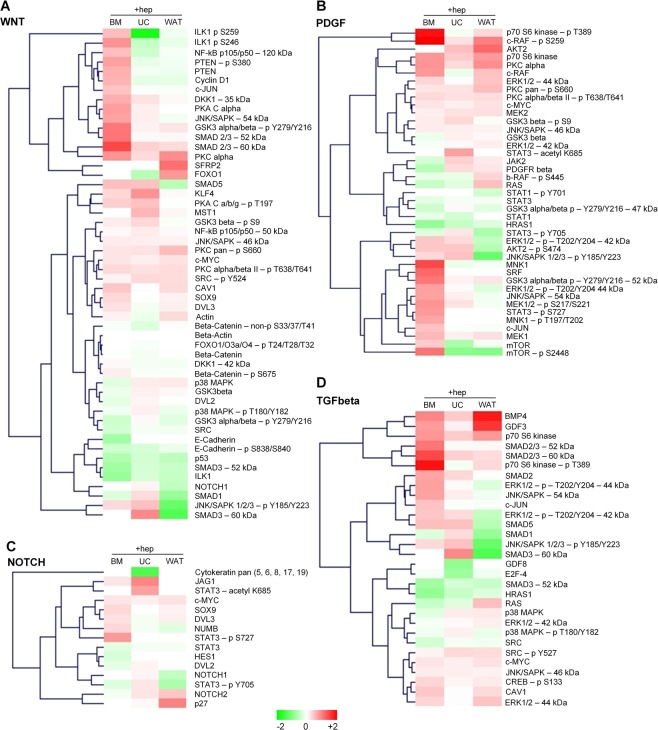
Figure 6.
Heparin differentially affects protein expression levels of WNT-, PDGF-, NOTCH- and TGFbeta signaling pathways. The heatmaps of (A) WNT-, (B) PDGF-, (C) NOTCH- and (D) TGFbeta-pathways reflect the positive and negative ratios of protein expression of BM-, UC- and WAT-derived stromal cells with and without heparin exposure (depicted as +hep) with red color indicating over- and green color under-representation compared to cells without heparin. Cells were cultured as described in the legend to Fig. 5, subjected to DigiWest multiplexed protein profiling and subsequent data analysis as described in the methods section.

