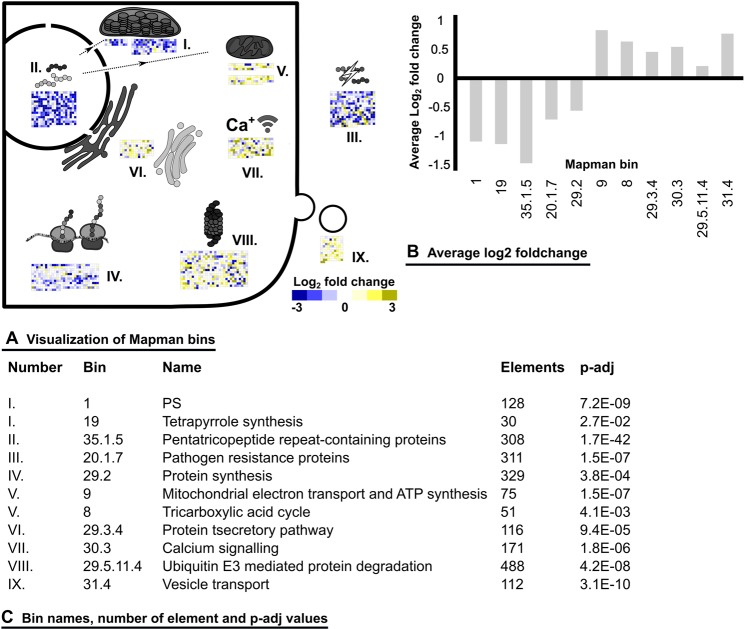
Figure 4.
Mapman analysis between the symptomless interaction zone 1 and zone 2 with light discoloration. Fold-changes calculated by DESeq were depicted with Mapman. For fold-changes, a clipping was set at an absolute change of Log2 3 and p-adj values are based on FDR corrected Wilcoxon ranked sum test. (A) Visual representation of selected Mapman bins. (B) Calculated average Log2 fold-changes of Mapman bins. (C) Names of depicted Mapman bins, number of elements and p-adj values.

