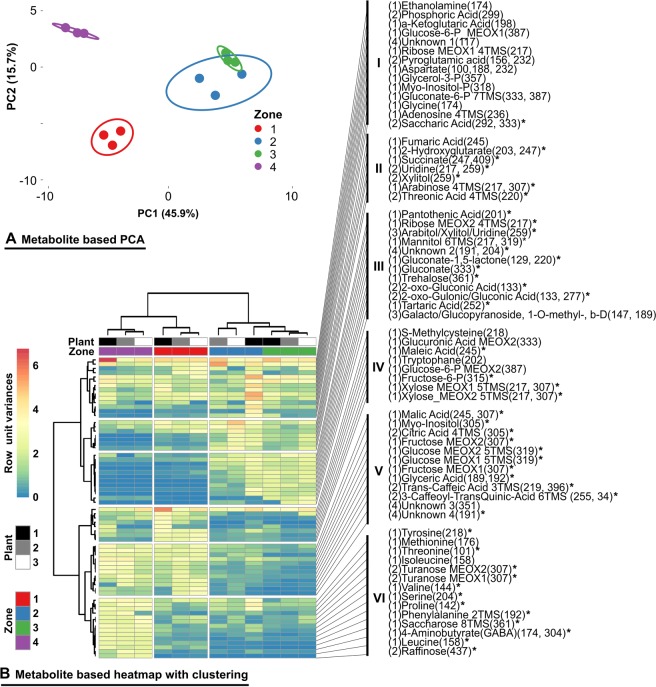
Figure 6.
Abundances of selected metabolites within the interaction zones. (A) PCA plot based on metabolite abundances. (B) Metabolite based heat map; unite variance scaling was applied on rows and Ward clustering was used for rows and columns31. The designations of single metabolites include the indicator of the level of identification within the first brackets, according to the reporting standards as proposed by the Metabolomics Standards Initiative43 ranging from (1): identified by the measurement of the chemical reference standard, (2): putatively identified by significant database hit, (3): putatively characterized by database hit as compound of a certain chemical class, (4): unknown compound. The chemical name of the compound is accompanied in relevant cases by the information concerning the derivatization status (MEOX, TMS). The last brackets indicate the m/z values, which have been used for the identification and the integration of the signals corresponding to the given metabolite. The asterisks indicate significance as tested with ANOVA. The complete dataset can be found in Supplementary Table S8 as well as an enlarged depiction of heatmap B in Supplementary Fig. 2.

