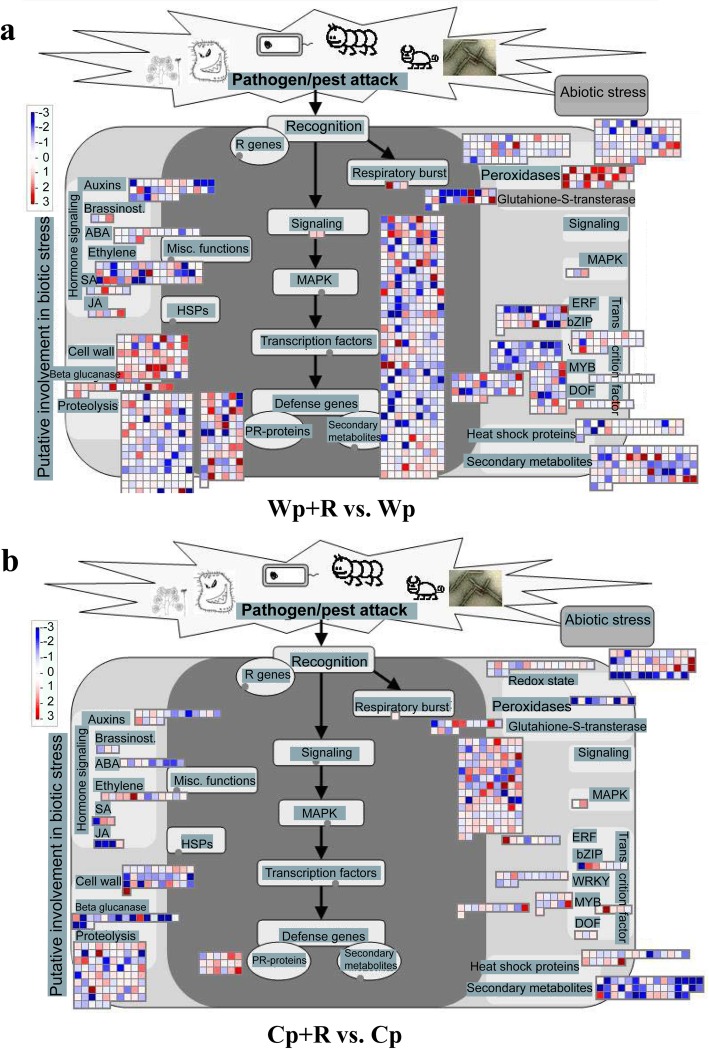
Fig. 6.
Analysis of the biotic stress response of Rhizoglomus intraradices-inoculated plants to infection by Magnaporthe oryzae using MapMan 3.6.0. ‘Wp+R vs. Wp’ (a) and ‘Cp+R vs. Cp’ (b) comparisons. Cp + R, R. intraradices-inoculated cultivated rice infected with M. oryzae; Cp, R. intraradices-uninoculated cultivated rice infected with M. oryzae; Wp + R, R. intraradices-inoculated wild rice infected with M. oryzae; Wp, R. intraradices-uninoculated wild rice infected with M. oryzae. Red color intensity indicates the levels of up-regulation by log2 (fold-change) > 0 and P value < 0.05. Blue color intensity indicates the levels of down-regulation by log2 (fold-change) < 0 and P value < 0.05

