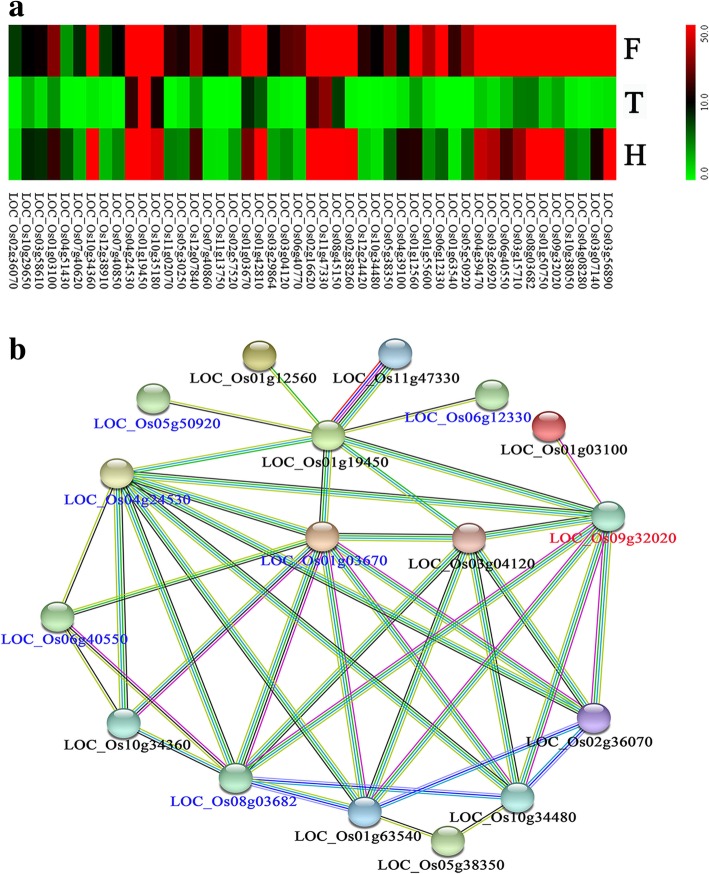
Fig. 6.
Gene expression levels of 47 genes and predicted protein-protein interaction network. a, The distribution of 47 genes exhibited up-regulation in F1 hybrid and H1 compared to T449 and down-regulation in T449 compared to E249 during meiosis stage, b, Predicted protein-protein interaction network of differently expressed genes (black), meiosis-specific (blue) and meiosis-related (red) genes. T represents T449, F represents hybrid, and H represents H1

