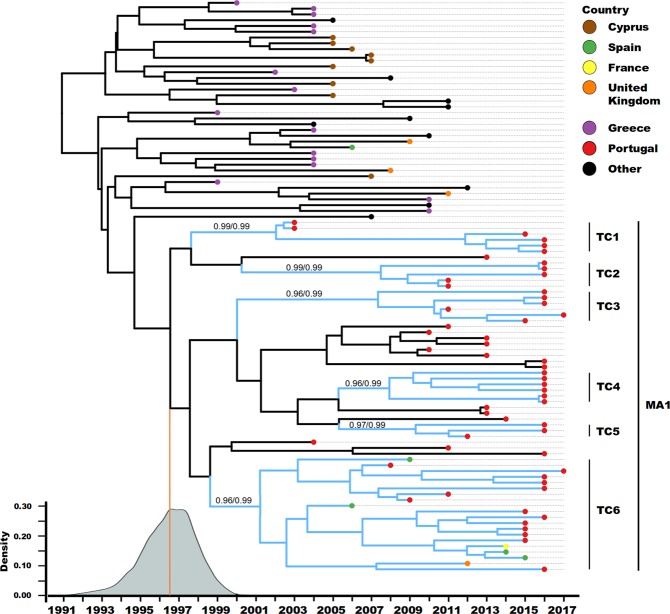
Figure 2.
Evolution of the study sub-subtype A1 transmission chain through its most recent history in several European countries. Maximum clade credibility tree summarised from the output trees from the BEAST analyses (n = 99). The tip point colours represent the country where the samples were collected. The blue branch lines indicate that the respective HIV-1 sequence belong to a transmission cluster. The vertical black bars demonstrate the taxa included in each transmission cluster and the main A1 clade (MA1). The aLRT SH-like branch support and posterior probability (pp) of each of the transmission clusters is displayed (aLRT/pp). The density plot in the bottom left refers to the time of the most recent common ancestor of the MA1. The country of sampling of the taxa labelled as others is: USA (3); Belgium (3); Sweden (1); Australia (1); The Netherlands (1), and Kuwait (1).

