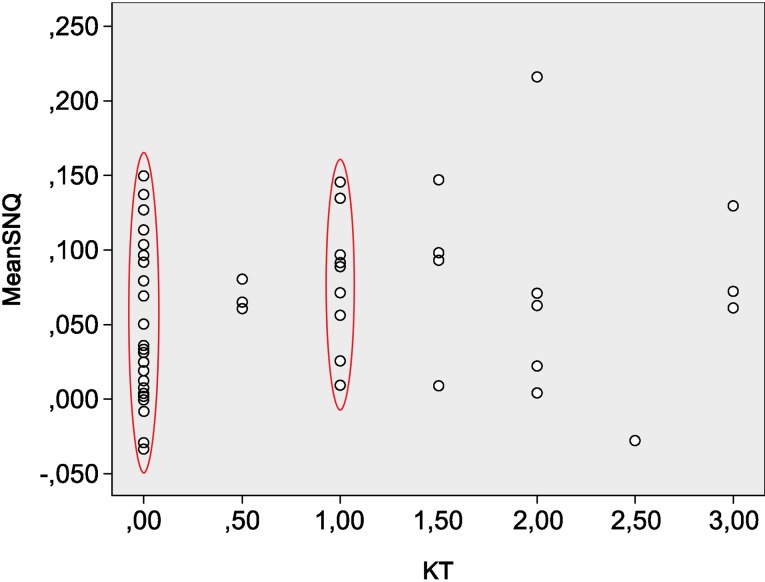
Fig. 4.
In the ACL-reconstructed group, the dispersion graph shows that the mean ATT measurement with the KT-1000 arthrometer is 0.7 mm (0–3 mm). Patients with an ATT between 0 and 1 mm had a mean SNQ of 0.1, but a poor correlation was found between mean SNQ and KT-1000 findings, both with Pearson and Spearman coefficients. In fact, the majority of cases (73% of the operated patients) were concentrated in the range between 0 and 1 mm, while only 8% of patients had a borderline value (3 mm) of laxity

