Fig. 1.

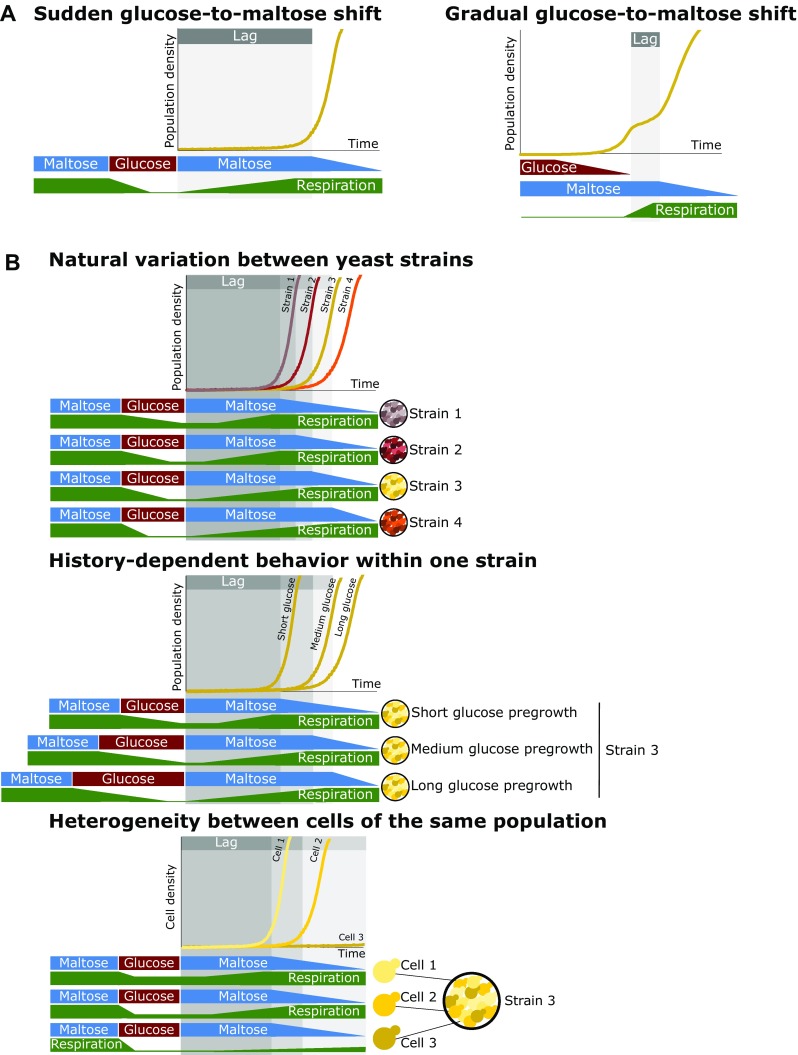
Overview of the different aspects of the lag phase and its link to respiration. a General experimental setups for measuring lag times. Left: cultures adapted to growth on maltose are transferred to glucose. After a specific time on glucose, cultures are washed into maltose and experience a lag phase. When transferred from maltose to glucose, the yeast cells induce glucose repression of the respiratory metabolism. Upon transfer to maltose, cells induce respiration to efficiently escape the lag phase to maltose. Right: cultures adapted to glucose are transferred to low-glucose media supplemented with maltose. Glucose is preferentially consumed, and upon depletion, cells experience a lag phase before growing on the available maltose. During glucose growth, respiratory metabolism is repressed. Upon depletion of glucose, respiration is induced to efficiently start growing on maltose. b Top: the natural variation in lag times between different S. cerevisiae strains correlates with the level of glucose repression of the respiratory metabolism. Middle: history-dependent behavior within one strain shows that the lag time depends on the time grown in glucose. Longer growth periods in glucose allow for more complete repression of respiration and thus give rise to longer lag phases upon a shift to maltose. Bottom: heterogeneity in lag times within an isogenic population. Cell density in figure is derived from colony size measurements. Within a population, some cells show stronger repression of respiration and thus longer lag phases, whereas other cells have more relaxed repression and thus show shorter lag phases
