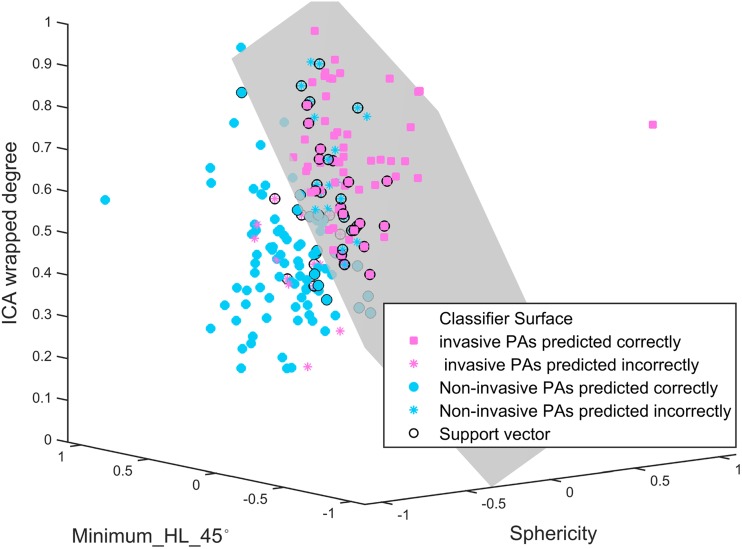
Fig. 3.
Radiomics predictive model. This model was plotted to facilitate the comprehension. The model was built based on CE-T1 MR images using linear SVMs. The x, y and z axes represent the features of Sphericity, Minimum_HL_45°, and ICA wrapped degree, respectively. These three features were normalised to the range of -1 to 1. The grey plane represents the classifier surface. The points (pink squares and sky-blue asterisks) above the classifier surface were predicted as PAs with CS invasion, while the points (sky-blue solid points and pink asterisks) below the classifier surface were predicted as PAs without CS invasion. The pink squares represent the PAs with CS invasion that were predicted correctly; the sky-blue solid points represent the PAs without CS invasion that were predicted correctly. The PAs with CS invasion, which was predicted incorrectly are shown as pink asterisks; the PAs without CS invasion, which were predicted incorrectly are shown as sky-blue asterisks. The black circles represent the support vectors calculated in the SVM model

