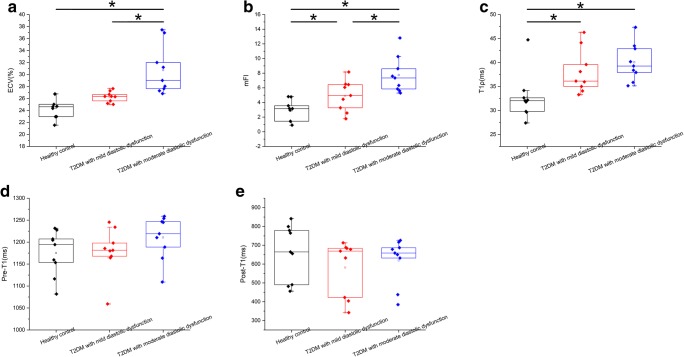
Fig. 1.
Results for animals with different degrees of diastolic dysfunction as compared with healthy controls. Differences in extracellular volume fraction (a), myocardial fibrosis index (b), T1ρ relaxation time (c), pre-contrast myocardial T1 (d), and post-contrast myocardial T1 (e) are compared between healthy control animals, monkeys with type 2 diabetes mellitus and mild diastolic dysfunction, and monkeys with type 2 diabetes mellitus and moderate diastolic dysfunction. Values in panels a–e are shown in box plots. One-way analysis of variance was used for comparing the differences among the three groups (this method was used for normally distributed data, including T1ρ, mFI, and pre-T1). For post hoc analysis, Fisher’s least significant difference test and the Student-Newman-Keuls test were used to compare the differences between every two groups. The Kruskal-Wallis H test was used to compare the differences among the three groups (this method was used for non-normally distributed data, including ECV and post-T1). The Dunn-Bonferroni test was used in post hoc analysis to compare the differences between every two groups. *p < 0.05

