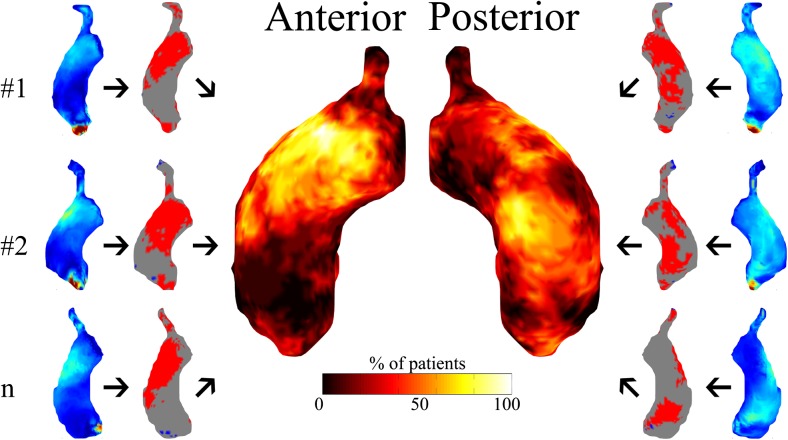
Fig. 2.
Individual patients’ (#1, #2 … #n) peak systolic wall shear stress (WSS) maps are compared with peak systolic 3D WSS atlases of controls, resulting in patient-specific WSS heat maps depicting regions with increased (red) or decreased (blue) WSS. The incidence map (centre) depicts the number of transcatheter aortic valve replacement (TAVR) patients (%) subject to increased WSS per region of the ascending aorta

