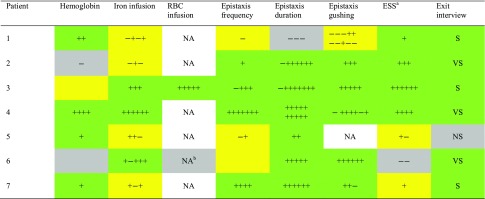
Table 1.
Primary and secondary outcomes
The number of + or − in each box represents the number and order of time periods (both during and after treatment) for which the patient met efficacy criteria for improvement or worsening, respectively, in the parameter as defined in the Methods section. The color of each box is a composite indicator of the perceived overall direction of change during the study based on the pattern and amplitude of the changes: green = overall improved; yellow indicates no overall change; gray indicates overall worse. For example, Patient 1 received 300 mg of iron at baseline and had two occasions where she received 600 mg in one period followed by 0 mg in the following period, suggesting a pattern of no overall change—thus the yellow box color
ESS epistaxis severity score, NA not applicable as the patient had either zero RBC or zero gushing during baseline period, NS not satisfied with treatment, S satisfied with treatment, VS very satisfied with treatment
aESS was assessed twice during treatment and four times after treatment except in Patient 5 (once during and once after treatment due to early exit from study) and Patient 7 (twice during and twice after treatment)
bPatient 6 received no RBC at baseline and two RBC during follow-up and was therefore considered overall worse—thus the gray box color

