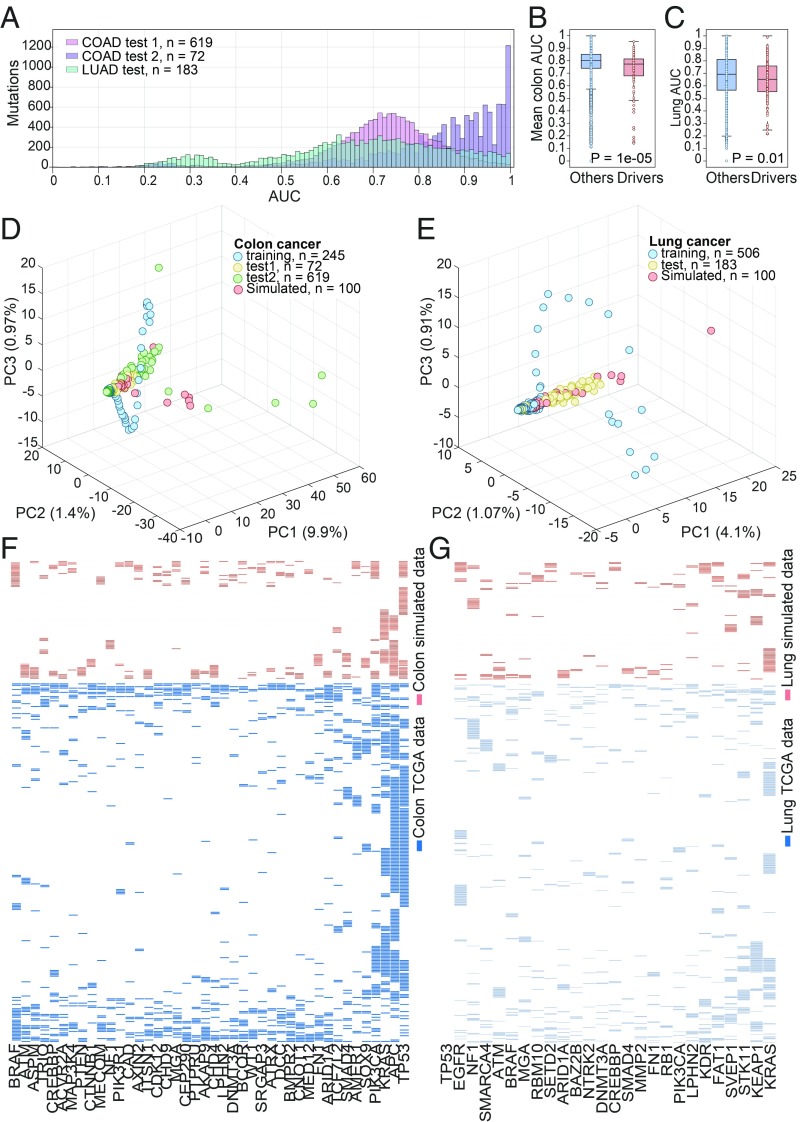
Fig. 2.
Prediction and generation of the sequence of mutations. (A) Histogram of mutations count (y axis) for each performance level (AUC; x axis) for mutation prediction in a sequence for colon cancer test sets (pink and purple bars for test sets 1 and 2, respectively) and for lung cancer test set (green bars). (B) Mean AUC of mutation prediction in the sequence for the two colon test sets: comparison of drivers with all other genes. (C) AUC of mutation prediction in the sequence for the lung test set: comparison of drivers with all other genes. (D and E) Scatter plots of PC1–PC3 obtained by PCA applied to the combined mutational data from all datasets used and the simulated samples, for colon and lung cancers, respectively. The percentage of variance explained by each PC is indicated in parentheses. (F and G) Presence–absence patterns for the high-frequency cancer drivers in the reconstructed mutational samples (red) and the TCGA mutational data (blue) for colon and lung cancers, respectively. The samples are ordered by the hierarchical clustering results, with the Euclidean distance metric and average linkage.

