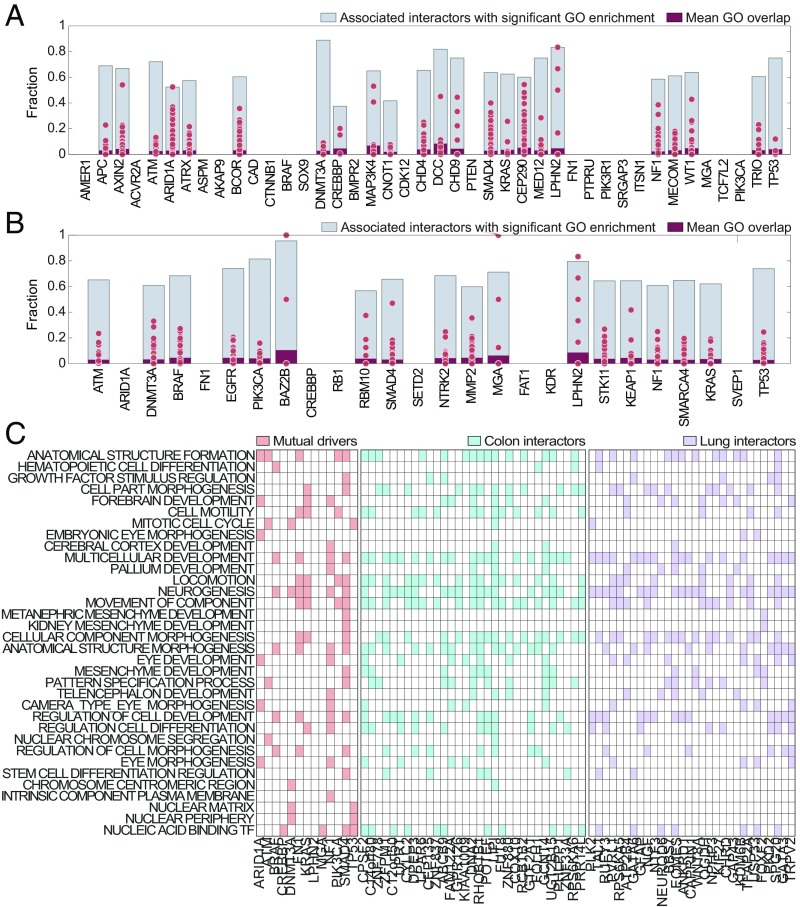
Fig. 4.
GO enrichment of the predicted interactions of major cancer drivers. (A and B) The gray bars show the fraction of GO processes associated with each major cancer driver that are significantly shared with its predicted interactors, for colon and lung cancers, respectively. The dot plots show the percentage of overlap of GO processes between each major driver and its predicted interactors (the red bar shows the mean of this distribution). (C) Heatmaps for GO processes enriched with the shared colon and lung major drivers and their interactors (presented are the interactors that are most strongly associated with these GO processes; for full information, see Dataset S6).

