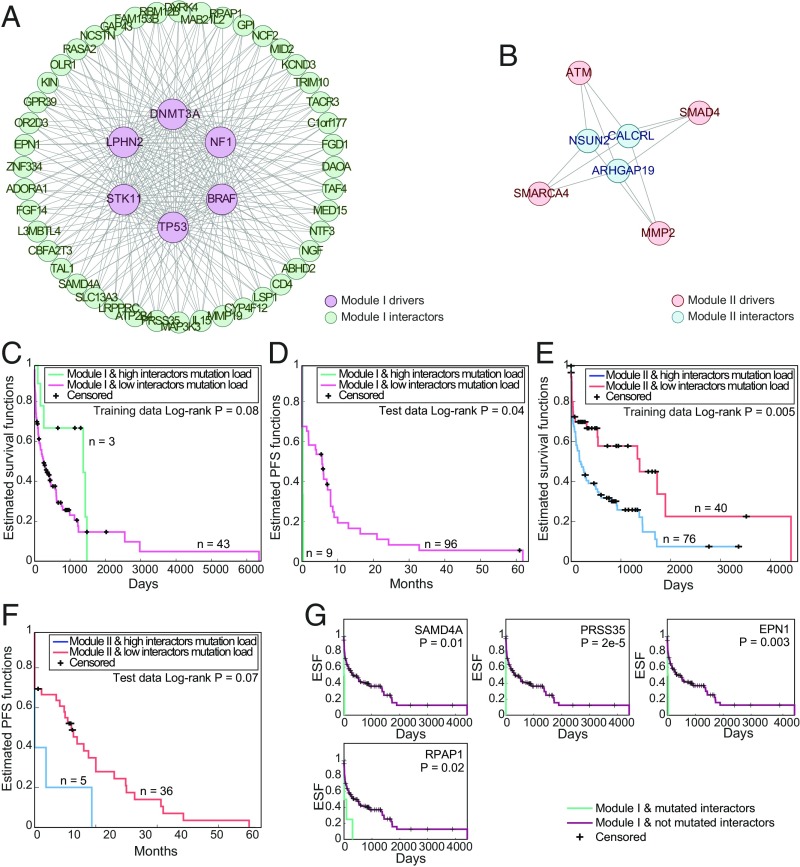
Fig. 6.
Modules of drivers and interactors in lung cancer. (A and B) The complete networks of interactions between modules of major lung cancer drivers (modules 1 and 2, respectively) and their predicted shared interactors. (C–F) Kaplan–Meier survival curves of TCGA colon cancer samples (overall survival; C and E) and the lung cancer test set samples (PFS; D and F) of samples with high mutation rate of driver modules I and II, respectively, with high vs. low number of mutation in the interactors of these modules (defined by the median). (G) Kaplan–Meier survival curves of TCGA colon cancer samples with high mutation rate of driver module I (defined by the median), with vs. without mutations of individual interactors of module I.

