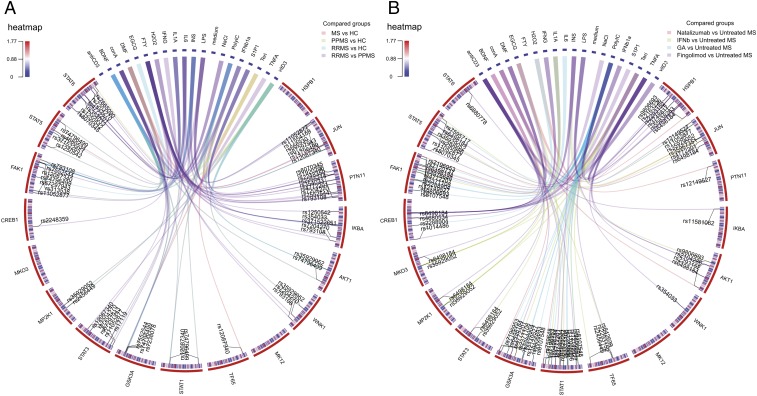
Fig. 3.
The phosphoproteomic signature in MS. The lines in the circle graph show the pairs of stimuli/phosphoproteins found to be significant and the corresponding MS susceptibility genes (ANOVA test for association between kinase levels and SNPs; Benjamini correction for multiple testing). The outer circle shows the 17 phosphoproteins analyzed and the 19 stimuli used, while the inner circle shows the 112 SNPs tested (color coded for the mean allelic distribution) where the SNP indicated by the link is referred to by its letter code. (A) Phosphoproteomic signature in MS, healthy controls, and the RMS and PMS subtypes of MS. (B) Phosphoproteomic signature of the DMDs compared with untreated RRMS patients.

