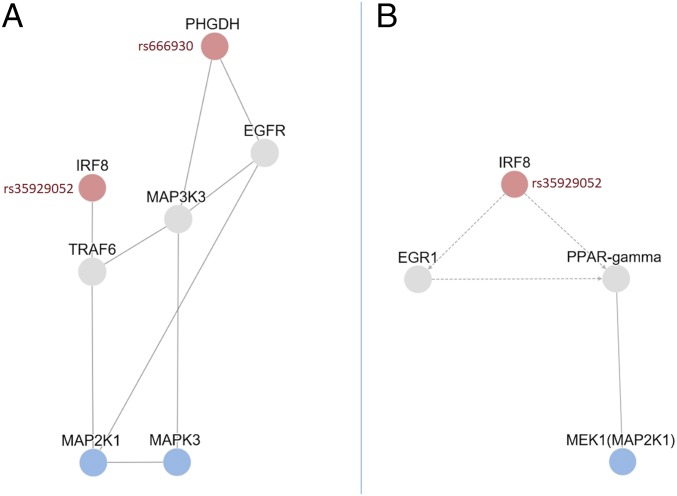
Fig. 4.
Protein network analysis of phosphoproteins and SNPs associated with MS. The graph shows the proteins from either genes containing MS-susceptibility SNPs (in red) or phosphokinases (in blue) found associated in our analysis. (A) First-order physical interactions of the studied proteins identified on the iRefIndex and MetaBase/MetaCore database. (B) Transcriptional regulation (dashed lines) and physical interactions (solid lines) of the associated proteins identified using the TieDie algorithm on the background of directed MetaBase network.

