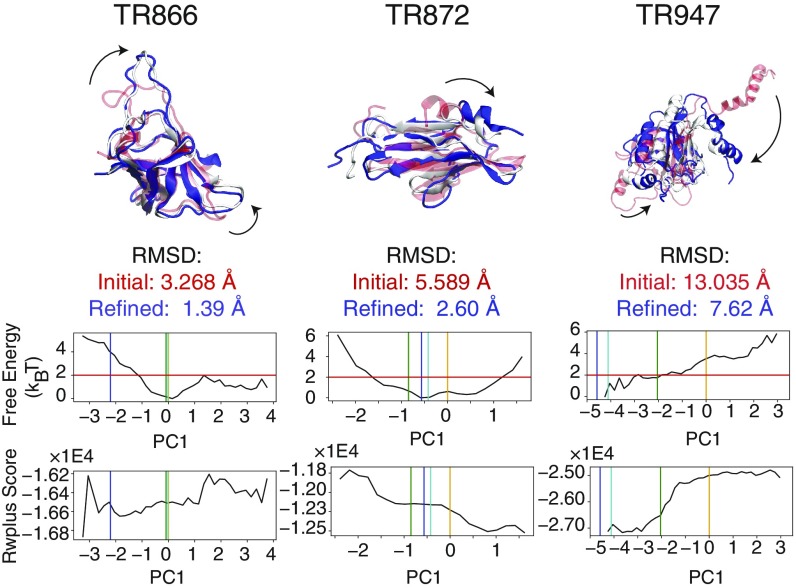
Fig. 3.
Three examples of the conformational changes upon refinement where PC-guided refinement improves the structure significantly: TR866, TR872, and TR947. (Top) In all of these cases, the initial structures (transparent red) have at least one domain that undergoes a significant structural transition (indicated by the arrows). These transitions are encouraged by the PC-guiding potentials. The resulting refined structures are shown in blue. The corresponding experimentally determined structures are shown in white. The structural representations of the complete list of proteins in this study are shown in Figure S7. (Bottom) The reweighted free-energy profiles as a function of the selected principal component are plotted for each set of refinement simulations. The vertical orange, green, cyan, and blue bars indicate the principal component values of the initial, top 1 selected, lowest rmsd, and experimentally determined structures, respectively. The horizontal red line indicates the relative free-energy threshold of from the most probable value of the principal component according to the reweighting of the refinement simulations. In the structure selection scheme, we first applied a “free-energy filter,” which selects structures with PC values in the regions below this threshold. The expectation value of the all-atom statistical potential RWplus (31) is plotted as a function of the principal component value (Bottom).

