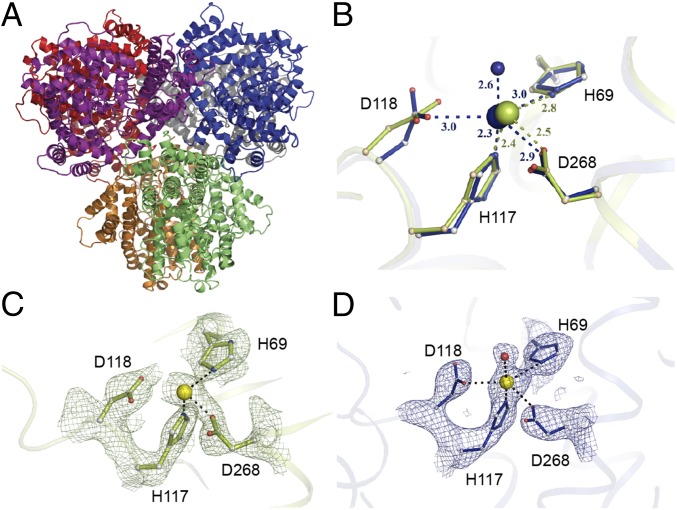
Fig. 2.
The hexameric Ec-dGTPase XFEL crystal structure. (A) Cartoon representation of the hexameric Ec-dGTPase XFEL crystal structure solved using 221 still images from randomly oriented crystals. (B) Differences in Mn2+ coordination for XFEL (blue) and low-dose synchrotron structure (olive green). Potential H-bond interactions with distances shorter than 3.5 Å are indicated as dashes between residues. (C) Electron density of the Sigma-A weighted 2Fobs − Fcalc map contoured at 1.5σ for residues comprising the HD motif (synchrotron data); Mn2+ ion is illustrated as a yellow sphere. (D) Electron density of the Sigma-A weighted 2Fobs − Fcalc map contoured at 1.5σ for residues comprising the HD motif (XFEL data). A water molecule (indicated in red) forms part of the Mn2+ coordination (SI Appendix, Fig. S2C).

