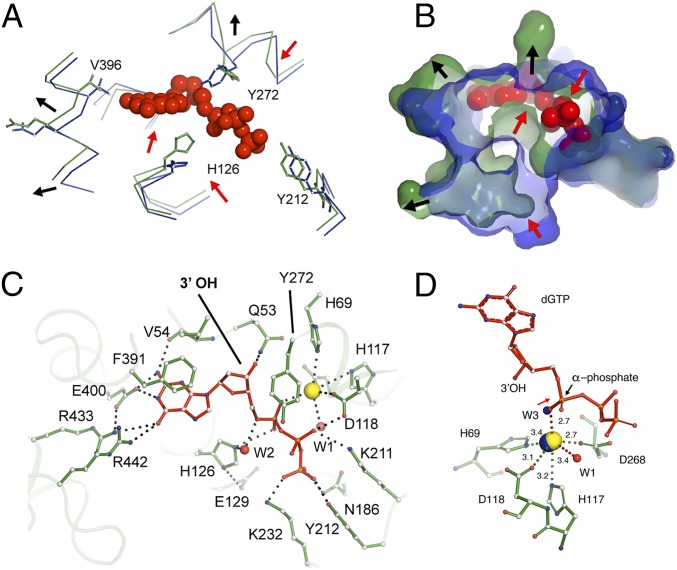
Fig. 3.
Interactions of dGTP substrate with Ec-dGTPase. Wire (A) and surface (B) representations of the overlay between the apo- (blue) and dGTP-bound (green) structures showing the conformational changes observed in the active-site pocket upon dGTP binding (red spheres). Red arrows indicate contraction, and black arrows indicate expansion of the pocket. (C) Ball-and-stick representation of key residues (green) involved in dGTP (red) binding. Hydrogen bonds are illustrated as dashes and water molecules as red spheres. (D) Ball-and-stick representation of Mn2+ (yellow sphere) coordination by dGTP residues (green). Distances are indicated next to dashes. The position of the apo-XFEL Mn2+ ion and coordinating water after overlay with the dGTP bound-structure are indicated as blue spheres.

