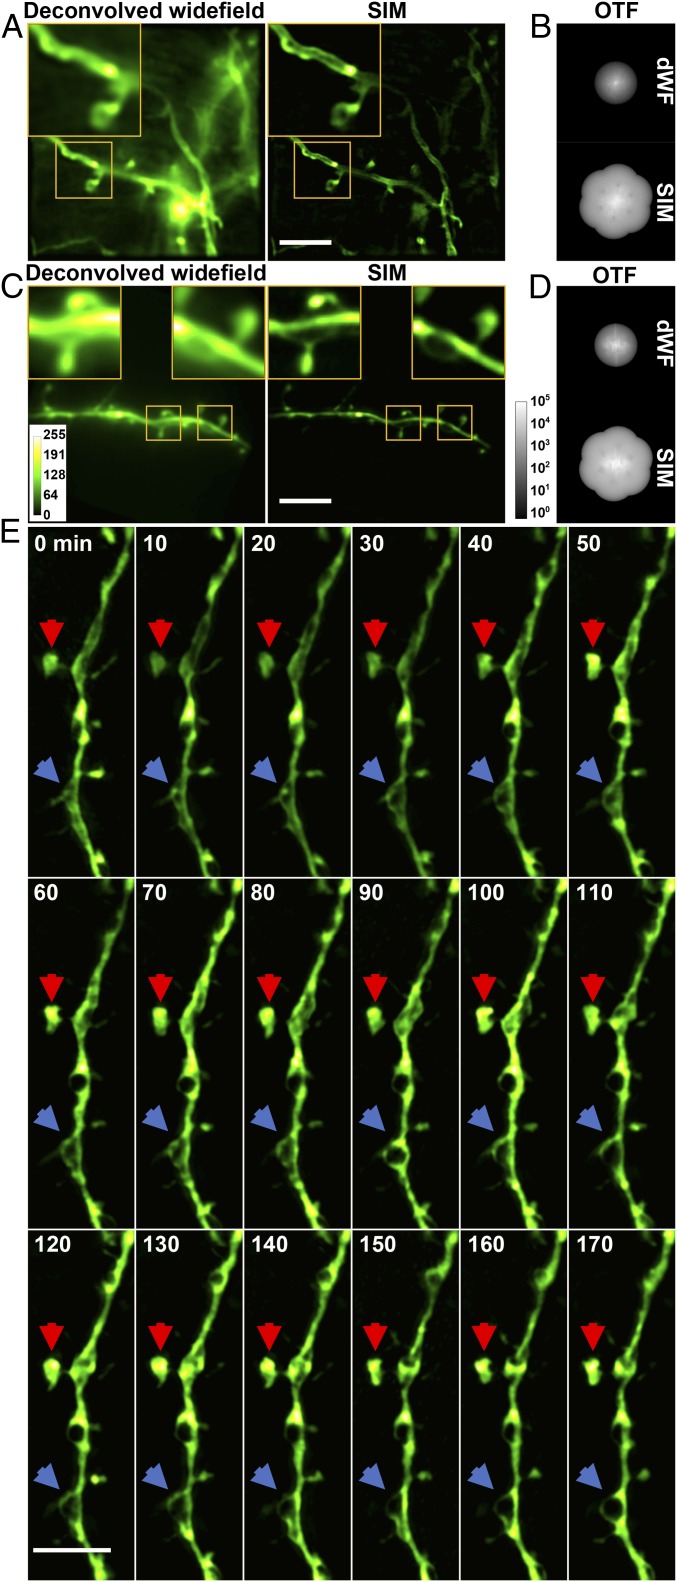
Fig. 4.
In vivo SR imaging of the mouse brain with AO SIM. (A) Deconvolved widefield (dWF) and SIM images of dendrites expressing ChR2-GFP, a membrane label. (Scale bar: 5 m; Inset width: 5 m.) (B) OTFs of the SIM and dWF images in A. (C) dWF and SIM images of neurons expressing cytosolic GFP (Thy-1 line M mouse). (Scale bar: 5 m; Inset width: 3 m.) (D) OTFs of the SIM and dWF images in C. (E) Time-lapse in vivo SIM images showing structural dynamics of a dendrite at a depth of 25 m in the brain of a Thy1-GFP line M mouse after KCl injection. Arrows point to highly dynamic structures. Images were normalized independently. (Scale bar: 4 m.)

