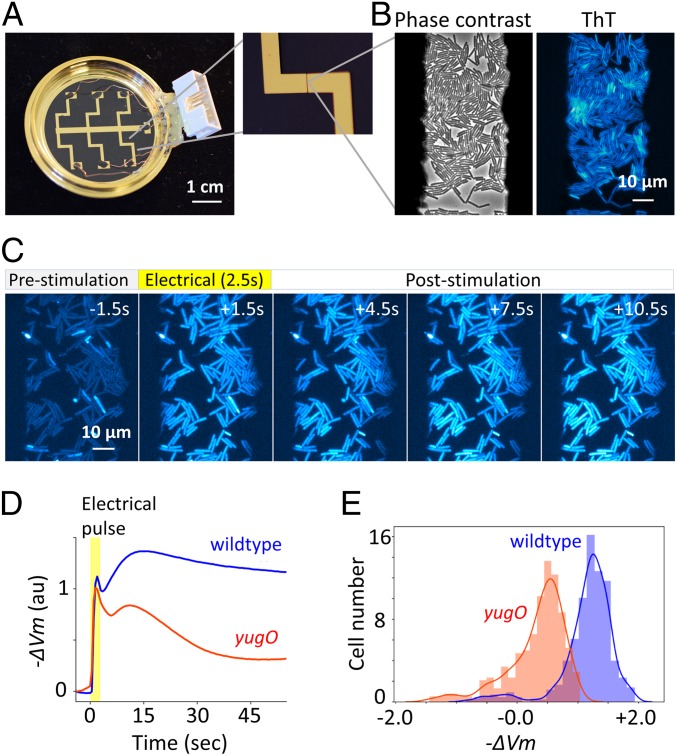
Fig. 1.
An apparatus enabling concurrent single-cell microscopy and stimulation with exogeneous electrical signal revealed hyperpolarization response to an electrical stimulus. (A) Bespoke glass-bottom dish coated with gold-titanium electrodes. Zoomed image on the Right shows 50-µm gap between electrodes. Dish is connected to relay circuit to apply electrical stimulation to bacterial cells (see SI Appendix, Figs. S1–S3 for details). (B) B. subtilis cells within the 50-µm electrode gap are visible in phase-contrast and ThT fluorescence images. (C) Film-strip images of ThT fluorescence of B. subtilis before, during, and after electrical stimulation. Increase in ThT fluorescence indicates hyperpolarization response to an electrical stimulus. (D) Mean −ΔVm over time for B. subtilis wild-type and yugO strains. −ΔVm was calculated by log(FThT/FThT,R), where FThT is ThT fluorescence and FThT,R is ThT fluorescence at resting state (SI Appendix). Time traces of individual cells are shown in SI Appendix, Fig. S4 (WT, n = 321; yugO, n = 308). Images were taken at 2 fps. (E) Histogram of −ΔVm at 30 s after electrical stimulation. The distributions of WT and yugO are clearly distinguishable.

