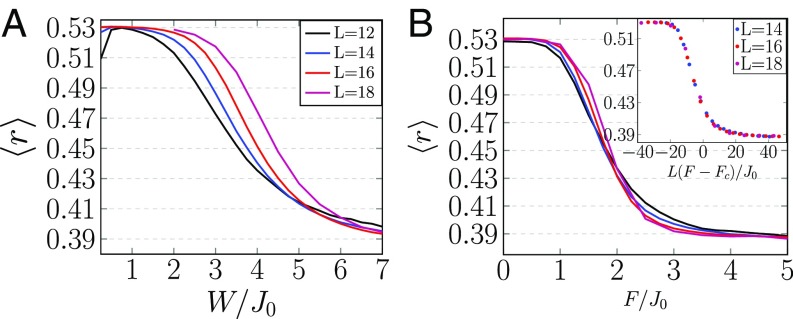
Fig. 2.
The -index as calculated for the Hamiltonian in Eq. 5 with for different system sizes, . In A the -index is plotted as a function of for zero linear field. In B the -index is plotted as a function of for a fixed disorder strength . (Inset) The data plotted as a function of with .

