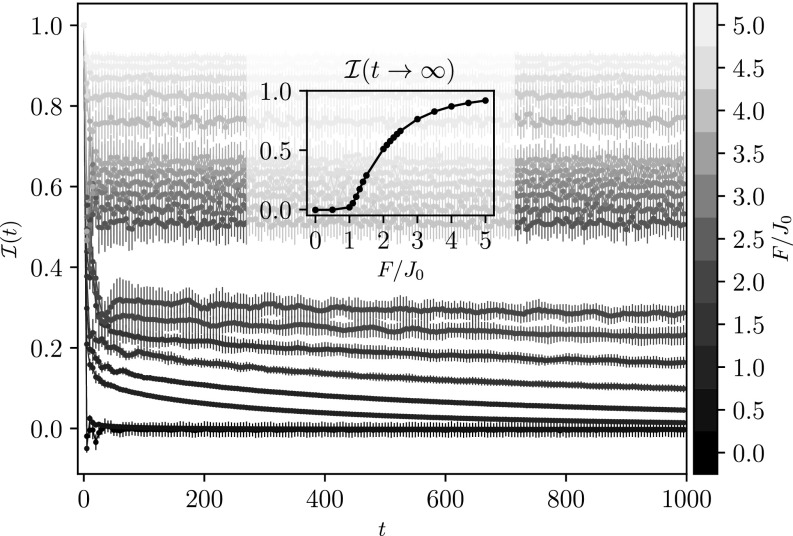
Fig. 3.
The imbalance as a function of time for different field strength and for fixed weak disorder , where . At , the imbalance for each field strength starts at . For field strengths above (and including) we cannot identify decaying behavior at these time scales. Error bars show statistical variance over 32 realizations of disorder. (Inset) The long time limit of the imbalance as a function of the field (averaged over the last 50 time steps). Below a critical value the long time limit of tends to zero, while above that value the long time limit tends to a finite value that increases with the field. Notice that some of the lower curves have not yet reached their final value.

