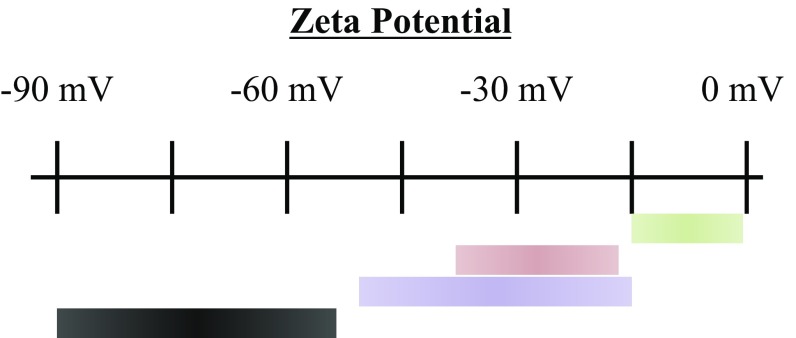
Fig. 2.
ZP values from different sources. Representation of the ZP value ranges of bare nanoemulsion samples. The ZP value ranges for samples from this work, prepared in glassware cleaned in isolated acid baths (green), in “contaminated” acid baths (red), and with aqueous phases stored in low-quality polyethylene (purple), are compared with a range of values commonly found in literature (black).

