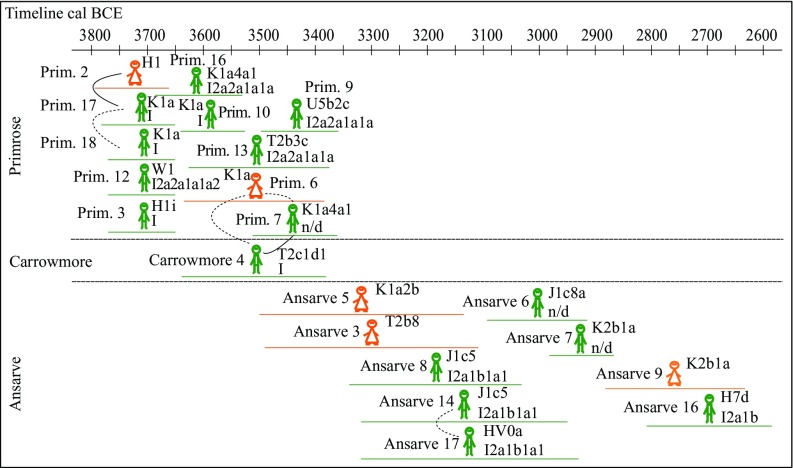
Fig. 3.
Kinship relationships in the Primrose, Carrowmore, and Ansarve burials. Solid line, first degree; dashed line, second degree. Males are displayed in green; females, in orange. The MtDNA and YDNA haplogroups are presented to the right of the figures. Bars underneath figures represent calibrated dating, with 95% CI (details in Table 1 and SI Appendix, Table S1).

