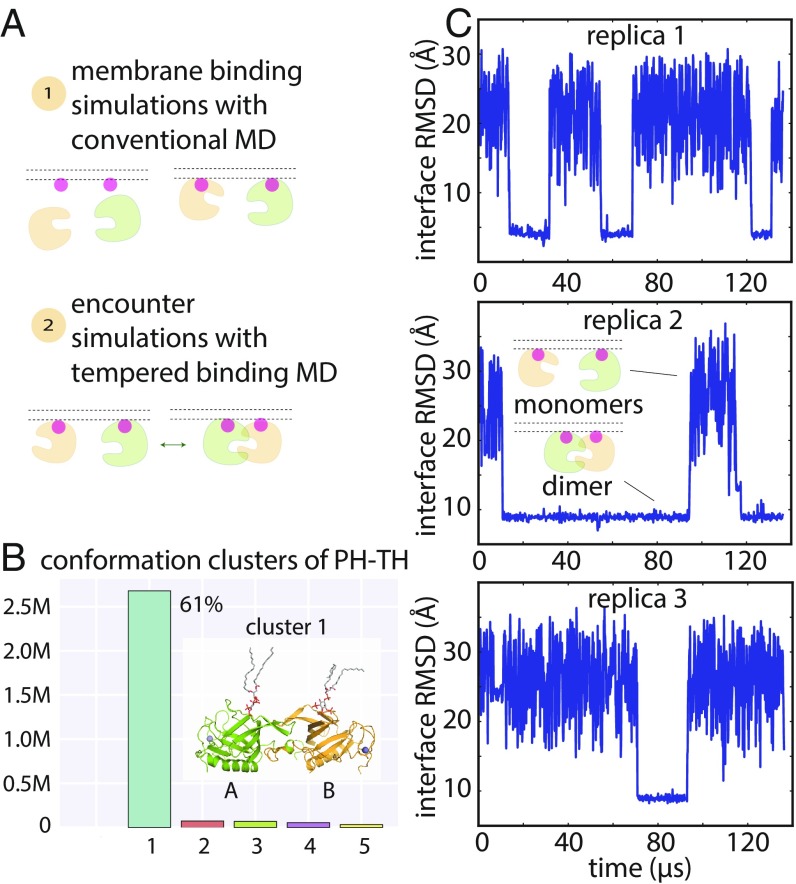
Fig. 2.
Dimerization of the PH–TH module on the membrane. (A) Cartoon illustration of an encounter simulation setup (see SI Appendix, Methods for details). (B) Conformation clusters of PH–TH dimers formed in the simulations (see SI Appendix, Methods for details). A representative structure of the most populated dimer conformation is shown (see Inset). (The PIP3 lipids bound in the canonical binding sites are also shown.) (C) Reversible dimerization of two membrane-bound PH–TH modules on a membrane that contains 1.5% PIP3 and 98.5% POPC in tempered binding simulations. The rmsd at the Saraste interface is calculated for all interface residues (residues 9, 11, 42, 44, 92, and 95) of the two modules with respect to the Saraste dimer interface conformation seen in a crystal structure of the PH–TH module (PDB ID code 1BTK). (This same interface rmsd calculation is used for the rmsd plots in all other figures, unless stated otherwise.)

