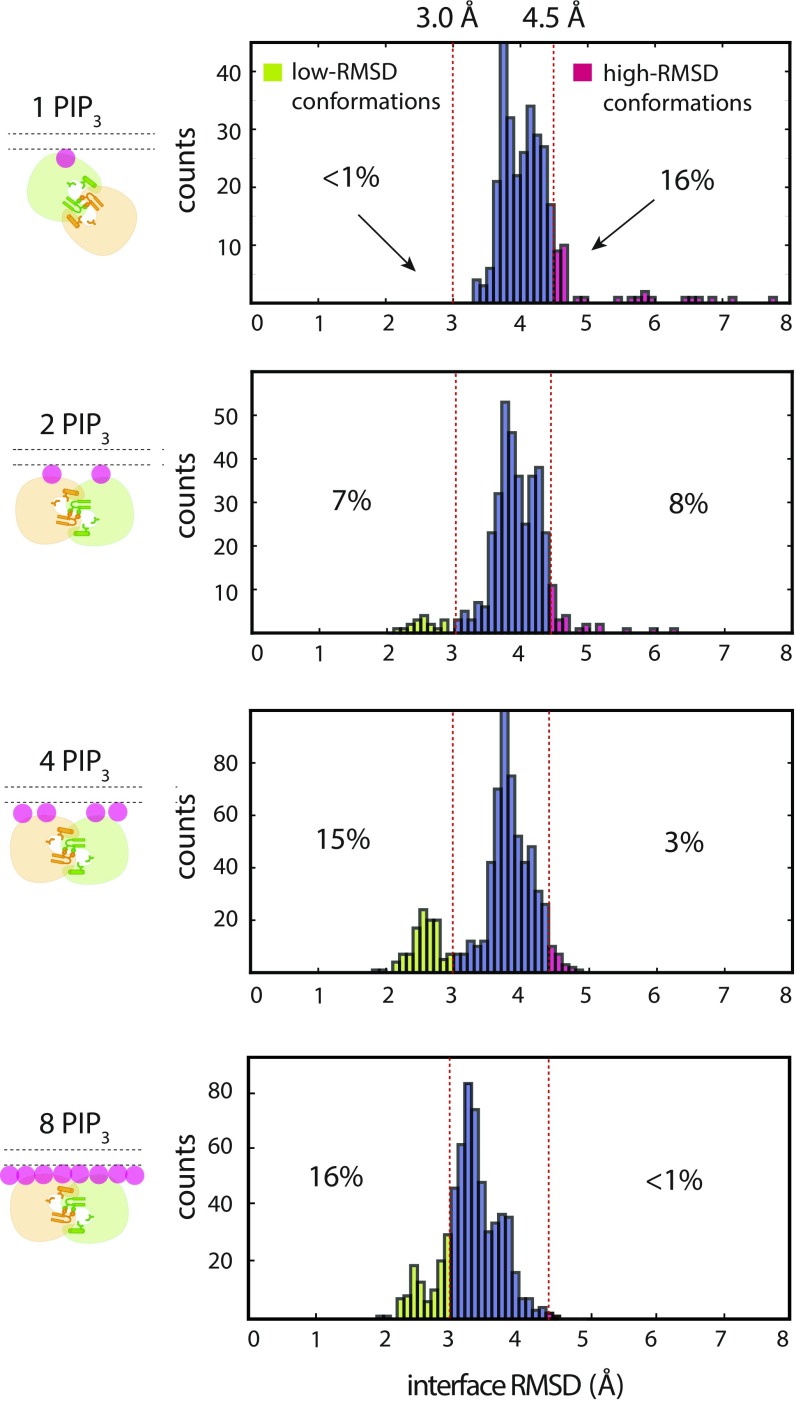
Fig. 6.
Sensitivity of fluctuations at the pre-Saraste dimer interface to membrane PIP3 concentration. Fluctuations at the pre-Saraste dimer interface are shown, measured under various membrane PIP3 concentrations. The histograms of the rmsd of the interface residues are calculated from 100-μs simulation trajectories initiated from Saraste dimers that originally formed in tempered binding simulations; only data from the portion of the trajectories where the interactions were unscaled are used.

