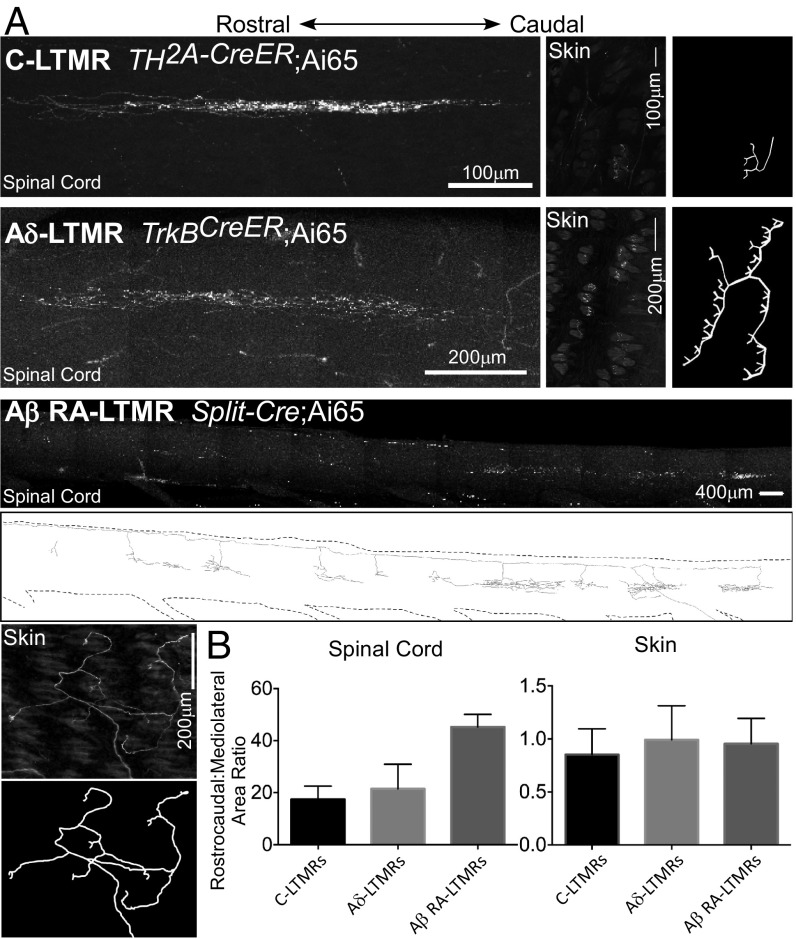
Fig. 5.
LTMR central projections show rostrocaudal elongation and mediolateral compression compared with their peripheral projections. (A) Representative images of whole-mount stain of spinal cord dorsal horn and back hairy skin to target C-LTMRs, Aδ-LTMRs, and Aβ RA-LTMRs. C-LTMRs are labeled using TH2A-CreER; Ai65 and 500 nL AAV1-Syn-FlpO injection to back hairy skin at P7 and 0.5 mg tamoxifen at P21. Aδ-LTMRs are labeled using TrkBCreER; Ai65 with 250 nL AAV-Syn-FlpO injection to back hairy skin at P12 and 2 mg tamoxifen at P21. Aβ RA-LTMRs are labeled using Split-Cre;Ai65 with 250 nL AAV-Syn-FlpO injection to back hairy skin at P11. Images are compressed z-projections. Scale, as well as relative rostrocaudal orientation, are indicated. Reconstructions of skin images are displayed for all three subtypes, as well as for the Aβ RA-LTMR spinal cord image. (B) Quantification of rostrocaudal:mediolateral ratio of area occupied by individual C-, Aδ-, and Aβ RA-LTMRs in spinal cord (Left) versus hairy skin (Right) (n = 21, 15, and 25 neurons for C-LTMRs, Aδ-LTMRs, and Aβ RA-LTMRs, respectively).

